Noob* Notes: Log Analytics with Fusion

Fusion Dashboards are a powerful tool for analyzing search logs over Fusion collections. A Fusion Dashboard has one or more controls which take search terms as inputs and one or more visualizations over the search results, including charts, graphs, tables, and maps (for geospatial data). Dashboards are powered by the open-source visualization tool Banana. Banana is a port of Kibana 3. A Banana dashboard is a set of JavaScript components for HTML5. Where Kibana communicates with Lucene, Banana communicates with Solr. The power of Solr facets provides interesting aggregations over the query results; the power of client-side JavaScript provides a dynamic, responsive browsing experience.
When you create a Fusion collection, e.g., a collection called “MyDataMyWay”, Fusion automatically creates a collection called “MyDataMyWay_logs” over the search logs, which is used by the Fusion Dashboards for search analytics reports. The power of the Dashboards tool can be leveraged to provide the same kinds of analytics over search logs from elsewhere.
This post shows you how to build a “Hello World” dashboard. To really appreciate what you can do with Fusion Log Analytics, check out our upcoming webinar: Faster Log Indexing with Fusion. Because I’m blogging for my fellow noobs, I’ll start from the very beginning: how to install and run Fusion. Non-noobs can skip the section Ready and skip ahead to section Set to see how to index your log data. If you’ve already got a Fusion collection over your log data and just want to understand how to use the Dashboards tool, skip ahead to section Go.
Ready: install and start Fusion
Download and unpack the Fusion distribution
Fusion is distributed as a gzipped tar file or as a compressed zip file which can be used directly to run Fusion as a single-server installation. In addition to the Fusion UI and back-end services, this package includes a Solr installation. The Linux and Mac distribution unpacks into a directory named “fusion” whereas the Windows distribution unpacks into a directory which contains a single subdirectory named “fusion”. This directory is the Fusion home directory, $FUSION. You must have a Java 7 or Java 8 JDK installed.
Start Fusion, set admin password
The script $FUSION/bin/fusion is used to start and stop Fusion via command line arguments “start” and “stop”, respectively. For Windows, this script is "$FUSIONbinfusion.cmd". To start Fusion from a terminal window (Linux or Mac):
>$FUSION/bin/fusion start
Successful startup results in 4 lines of output, showing the Fusion components and the ports they are listening on:
  2015-04-10 12:26:44Z Starting Fusion Solr on port 8983
  2015-04-10 12:27:14Z Starting Fusion API Services on port 8765
  2015-04-10 12:27:19Z Starting Fusion UI on port 8764
  2015-04-10 12:27:25Z Starting Fusion Connectors on port 8984
The online Fusion documentation contains complete installation instructions and troubleshooting tips.
Once Fusion is running, logon to the Fusion UI at http://localhost:8764/. After initial startup, you must first set the admin password. Next you have the option of registering your download. After this, and on all subsequent logins, the Fusion UI Launchpad is displayed:
The leftmost tool on the Launchpad is the Fusion Admin tool. The rightmost tool is the Dashboards tool. The Admin tool is used to create Fusion collections. The Dashboards tool is used to provide visualizations over these collections.
Set: get your logs
The more information and structure that can be extracted from the logfile and modeled in a Solr document, the more possibilities for analytics and visualizations. At a minimum log data must include:
- a timestamp in an allowed standard date/time format
- text message(s) which be unstructured or semi-structured
For this example, I’m using a logfile in .csv format that was originally part of a Kaggle machine learning competition dataset. The original logfile contains six columns, here we only use three of them: item id, query string, and query timestamp. The data looks like this:
  doc_id_s,query_s,query_time
  1004622,"Ghost adventurers","2011-10-10 23:13:07.632 EST"
  1004622,"Ghost sniper 360","2011-09-14 11:11:17.059 EST"
  1004622,"Sniper ghost warrior","2011-09-07 20:31:05.828 EST"
  1004622,"Sniper ghost","2011-10-16 11:50:43.068 EST"
  1004622,"Sniper x box","2011-09-20 12:39:31.64 EST"
  1004622,"Sniper: Ghost Warrior","2011-10-08 14:52:11.869 EST"
  1004622,"Snipper ghost recon","2011-10-24 12:07:01.265 EST"
Create a Fusion collection for your data
To create a new Fusion collection, I use the Fusion Admin tool. From the main Admin tool panel, I click “Collections” in the left navigation bar, and then click the “Add Collection” button. Enter a Collection name, e.g., “myData” then click the “Add” button. This creates a collection named “myData” and default index and query pipelines, both of which are named “myData-default”.
Fetch and index your data
Ingesting and indexing data is done via a Fusion Datasource configuration object which provides the coupling between a data repository, a Fusion collection, and the data processing pipeline. To configure and run a datasource which will do the fetching and indexing of the file “myData.csv”, go to the home page of “myData” collection, choose tab “Datasources” and click on the button “Add Datasource”. This brings up the datasource configuration panel. Configure it as follows:
- choose datasource “filesystem”, “local”
- choose indexing pipeline “myData-default”
- name the datasource “myData-source”
- enter the full path to the file “myData.csv” under section “Start Links”
Here is the configuration panel, with circles indicating key actions.
Note that the “Advanced” button in the top-right corner has been set to “On”. Setting this to on exposes the full set of configuration controls.
The “Splitting” tab is used to split out each row of the CSV file into a Solr document:.
Mapping CSV data into a fielded Solr document is simple, provided that there is a one-to-one mapping between data columns and document fields, and this is indeed the case here. The columns in “myData.csv” are:
- doc_id_s : string data
- query_s : string data
- query_time : time data
The column headings “doc_id_s” and “query_s” will be automatically converted to string fields because field names ending in “_s” are automatically typed as string fields. In order to index the query_time field as a date/time value, the field name should be either “query_time_dt” or “query_time_tdt”; these indicate Solr types datetime and trie_datetime respectively. The latter is far more efficient than the former.
The “Other” tab contains the mapping controls. On the expanded “Other” tab, Field Mapping is configured.
After saving this configuration, click the “run” button below the Datasource name. Upon completion, the number of documents in the collection should match the number of data rows (minus the header row) in the input file.
Zero documents indicates that for some reason, the request failed outright. All other mismatches indicate problems with format or content of one or more log entries. Be patient. Check the Fusion logfiles in directories $FUSION/logs/api and $FUSION/logs/connectors.
Using the Fusion Admin search tool, we confirm that the contents of the documents are in the correct fields with the correct formats.
Other types of log data can be ingested using the appropriate connector/pipeline combination. Variants of the above splitting/mapping approach will handle semi-structured or unstructured log formats, such as syslog or log4j. Fusion provides specialized connectors for other data sources, such as HDFS, and JDBC log data. Fusion 1.4 will include connectors for LogStash and FluentD (Flume).
Go: Visualize your logfile data using Fusion dashboards
The Fusion Dashboards tool is the rightmost icon on the Fusion UI launchpad page. It can be accessed directly as: http://localhost:8764/banana/index.html#/dashboard. When opened from the Fusion launchpad, the Dashboards tool displays in a new tab labeled “Banana 3”.
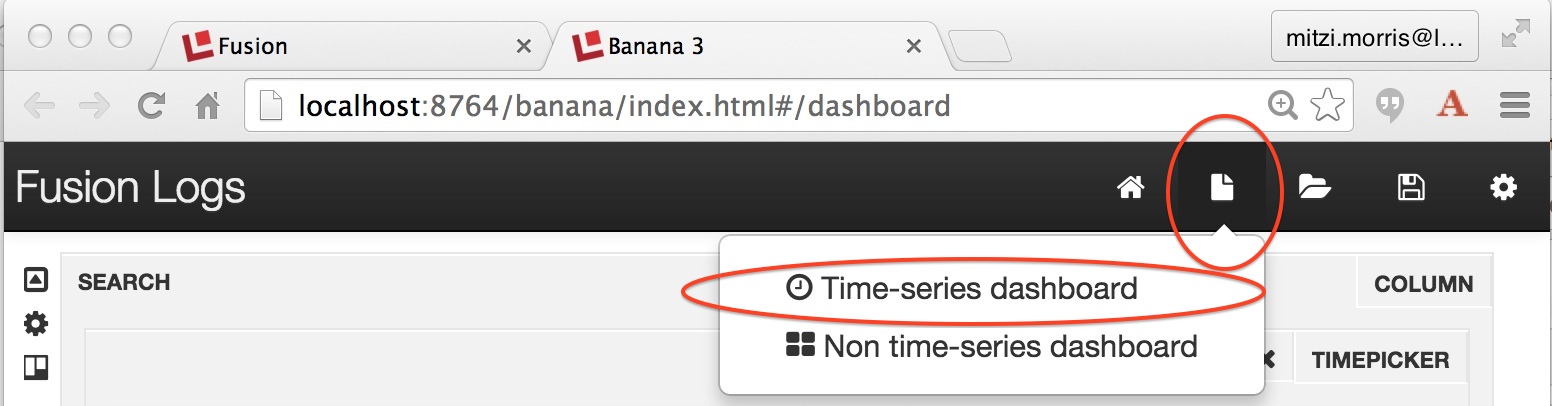
Time-series dashboards show trends over time by using the timestamp field to aggregate query results. To create a time-series dashboard over the collection “myData” (i.e., the collection containing your log data), you use the page icon in the upper right-hand corner of top menu, which provides a drop-down from which you can choose either a time-series of non-time series dashboard:
Choosing the time-series dashboard option results in the display of the “New Dashboard Settings” panel which configures the collection from which to fetch data and the field which is used to aggregate times, which must be in either _dt (Solr datetime) or _tdt (Solr trie-datetime) format. The latter is recommended over the former.
For this example, the Collection is “myData” and the Time Field is “query_time_tdt”. The newly created dashboard is called “New Time Series Dashboard” and it contains the following displays:
- Time Window – used to specify the time range over which to search
- Search – any Solr query
- Total Hits – the results of last query entered
- Filter – controls to the Solr query
- Histogram – shows aggregated events
- Table – shows selected fields of documents returned by the query
Here is the initial display, over data collected between August and November 2011:
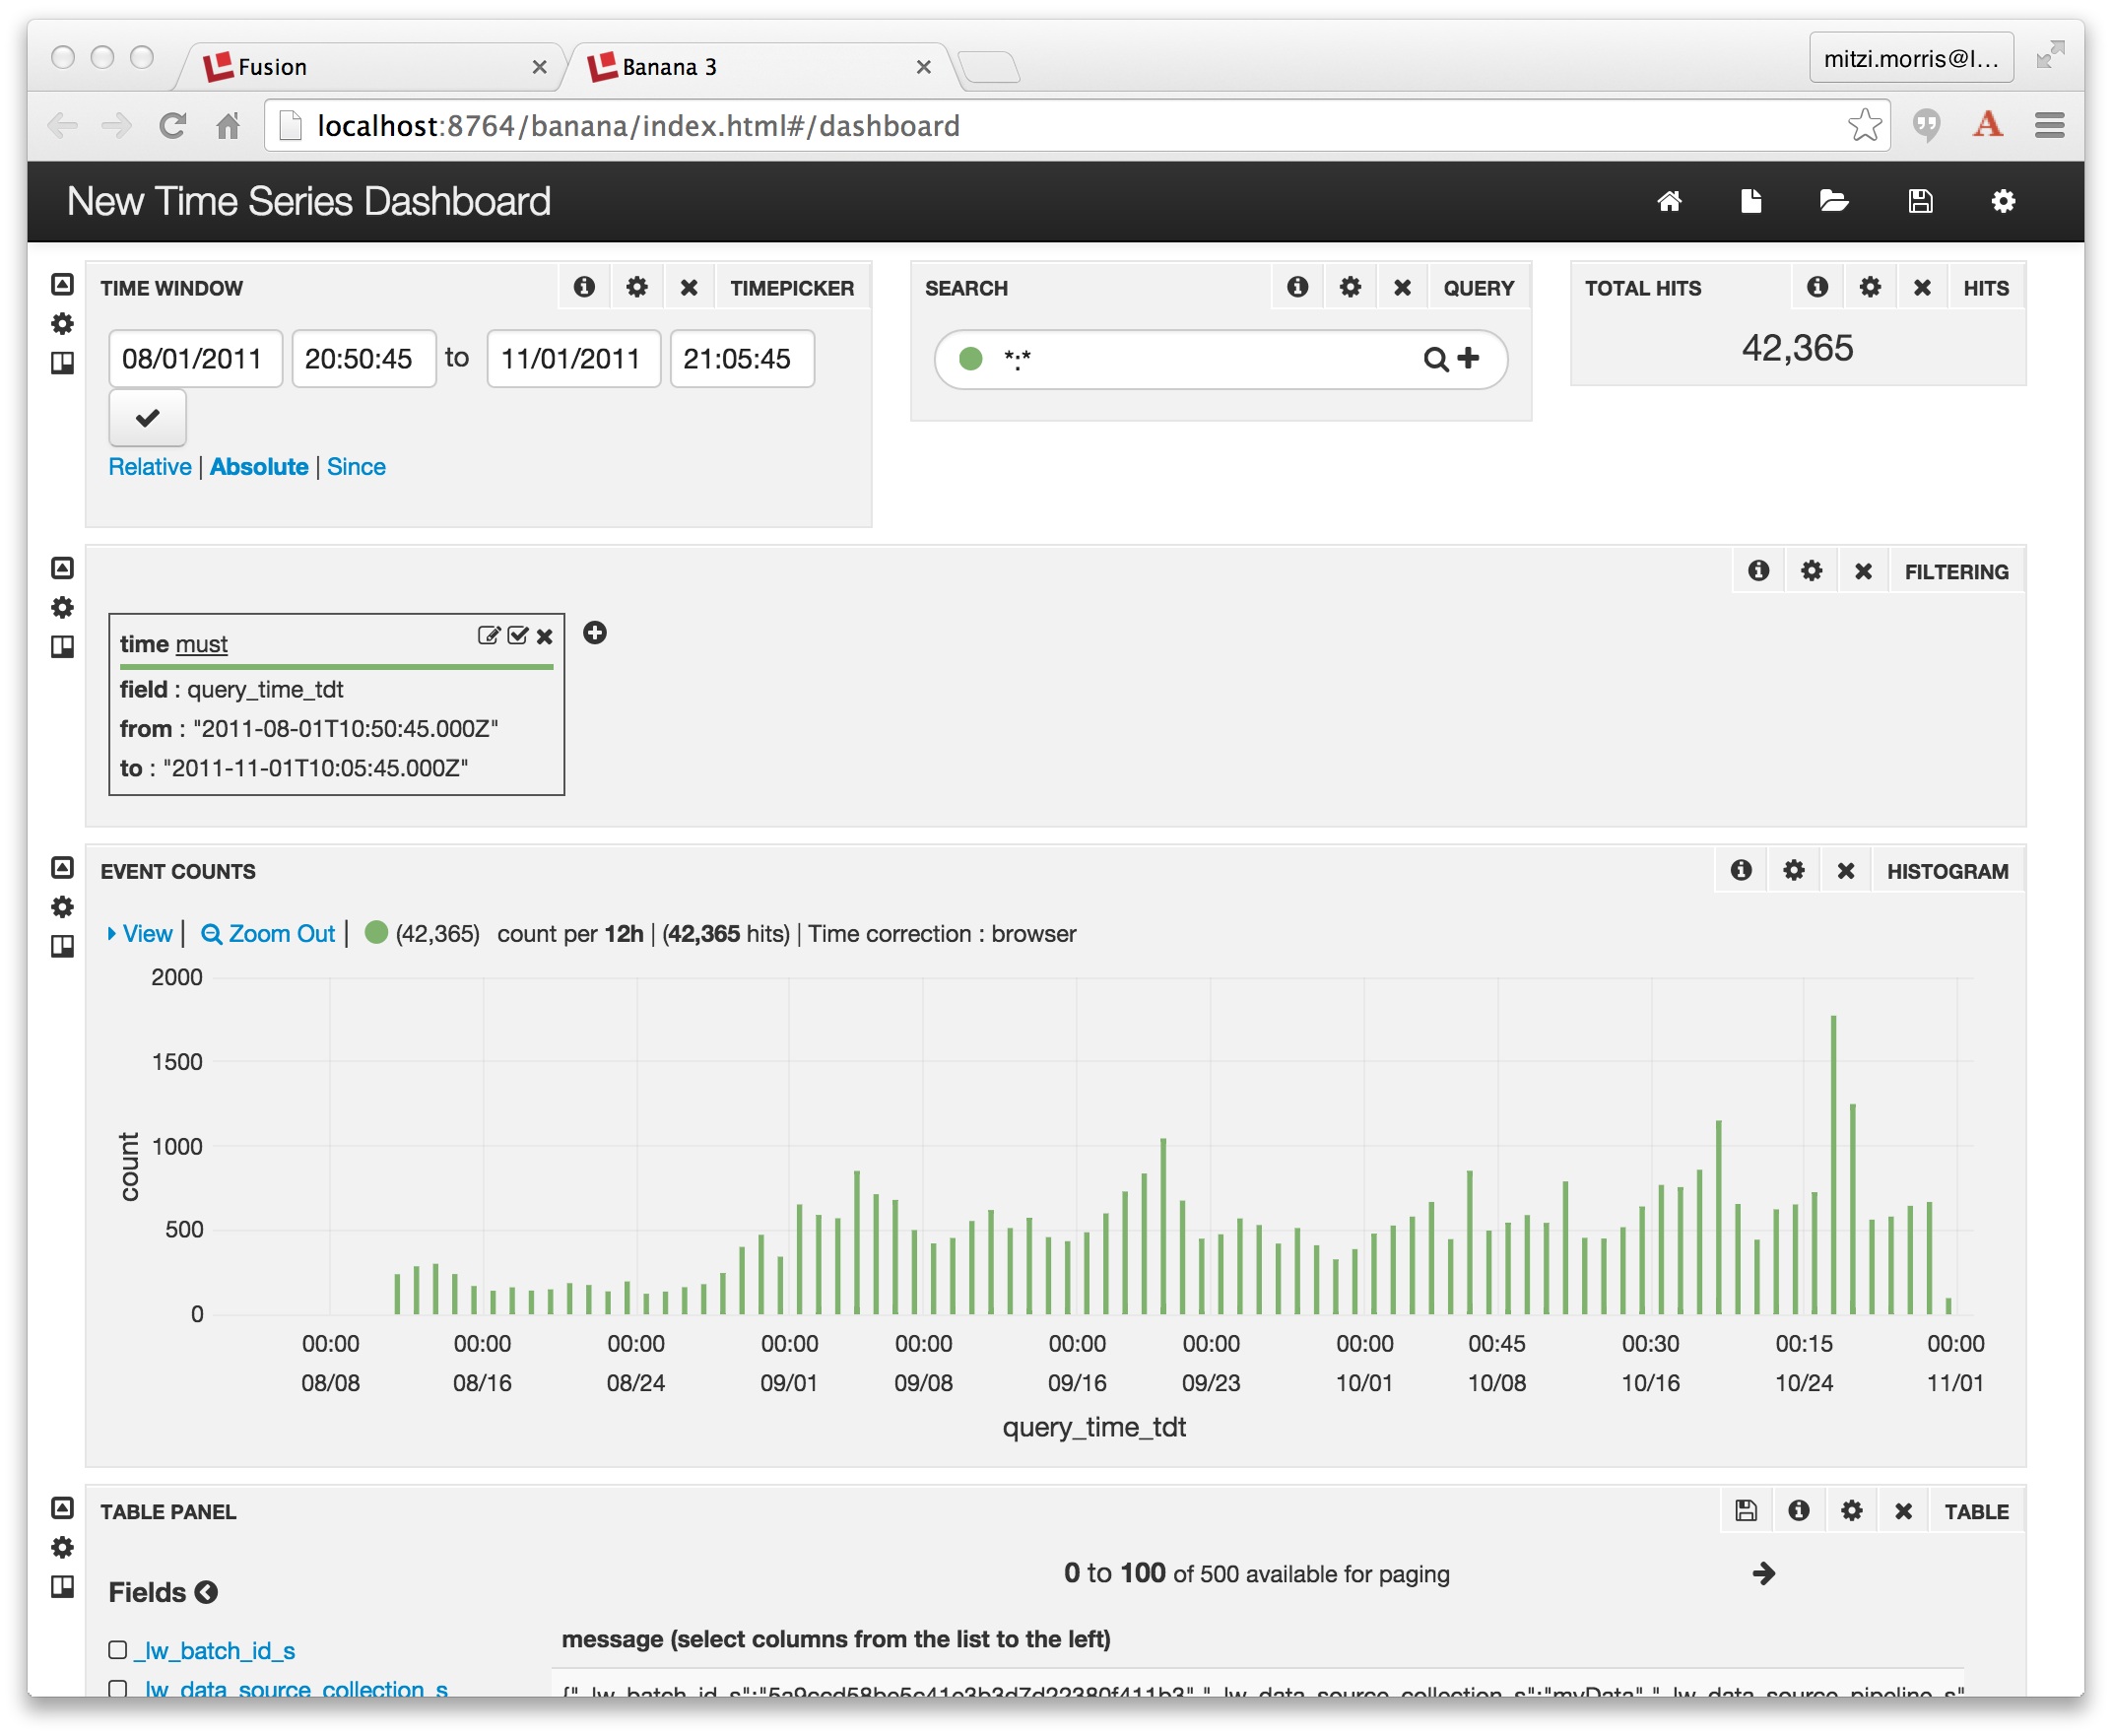
All of the elements of this dashboard can customized by clicking on the gear icon associated that element. In the screenshot below, we show the page-level controls, circled in red, the rightmost icon on the page title bar:
![]()
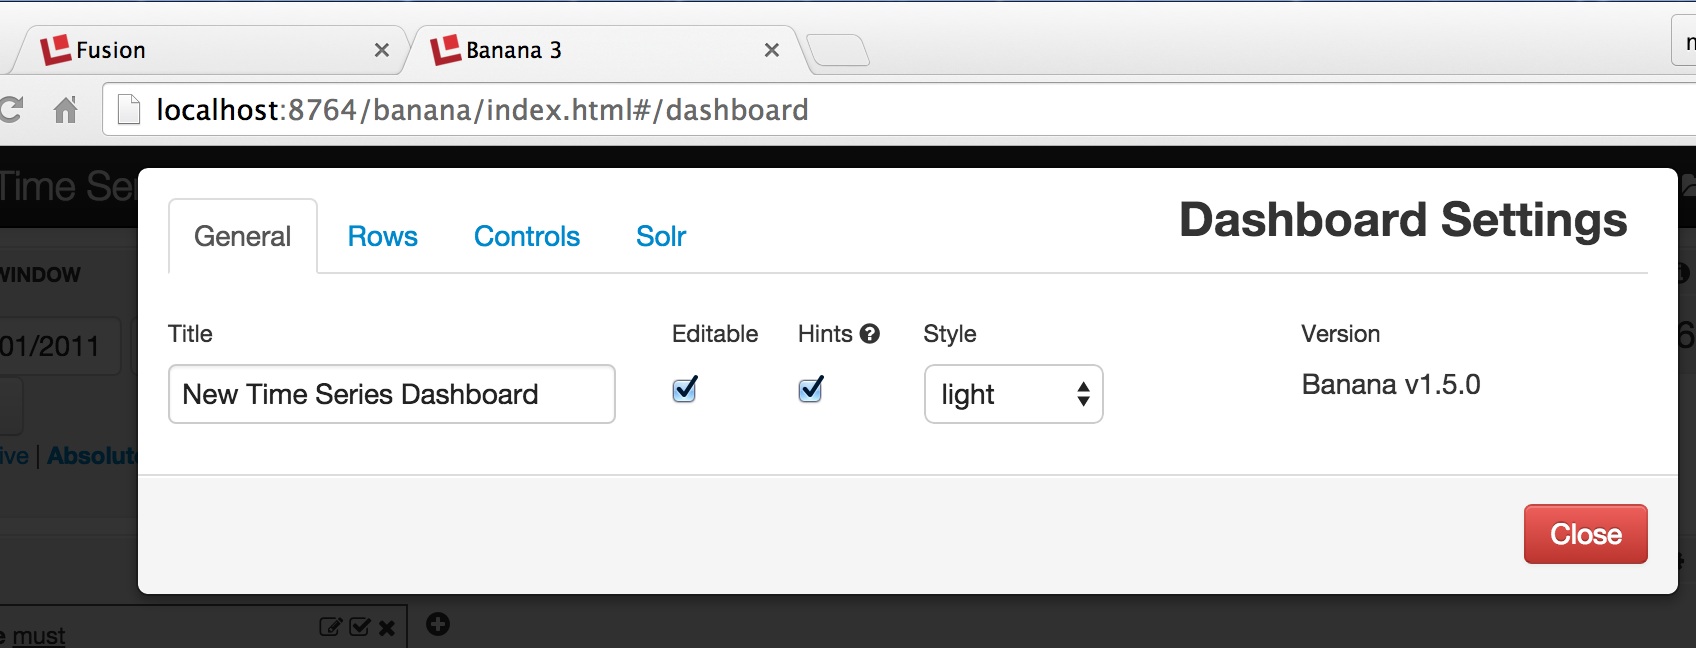
Clicking on this icon allows editing of page-level properties. In the screenshot below, we see the Dashboard settings control page, which has four tabs. The “General” tab is used to change the page title. The “Rows” tab controls the per-row visualizations, “Controls” are page-level controls, and the “Solr” tab controls settings: the collection to query, the name of the field used as the temporal sort field, and the default query parameters.
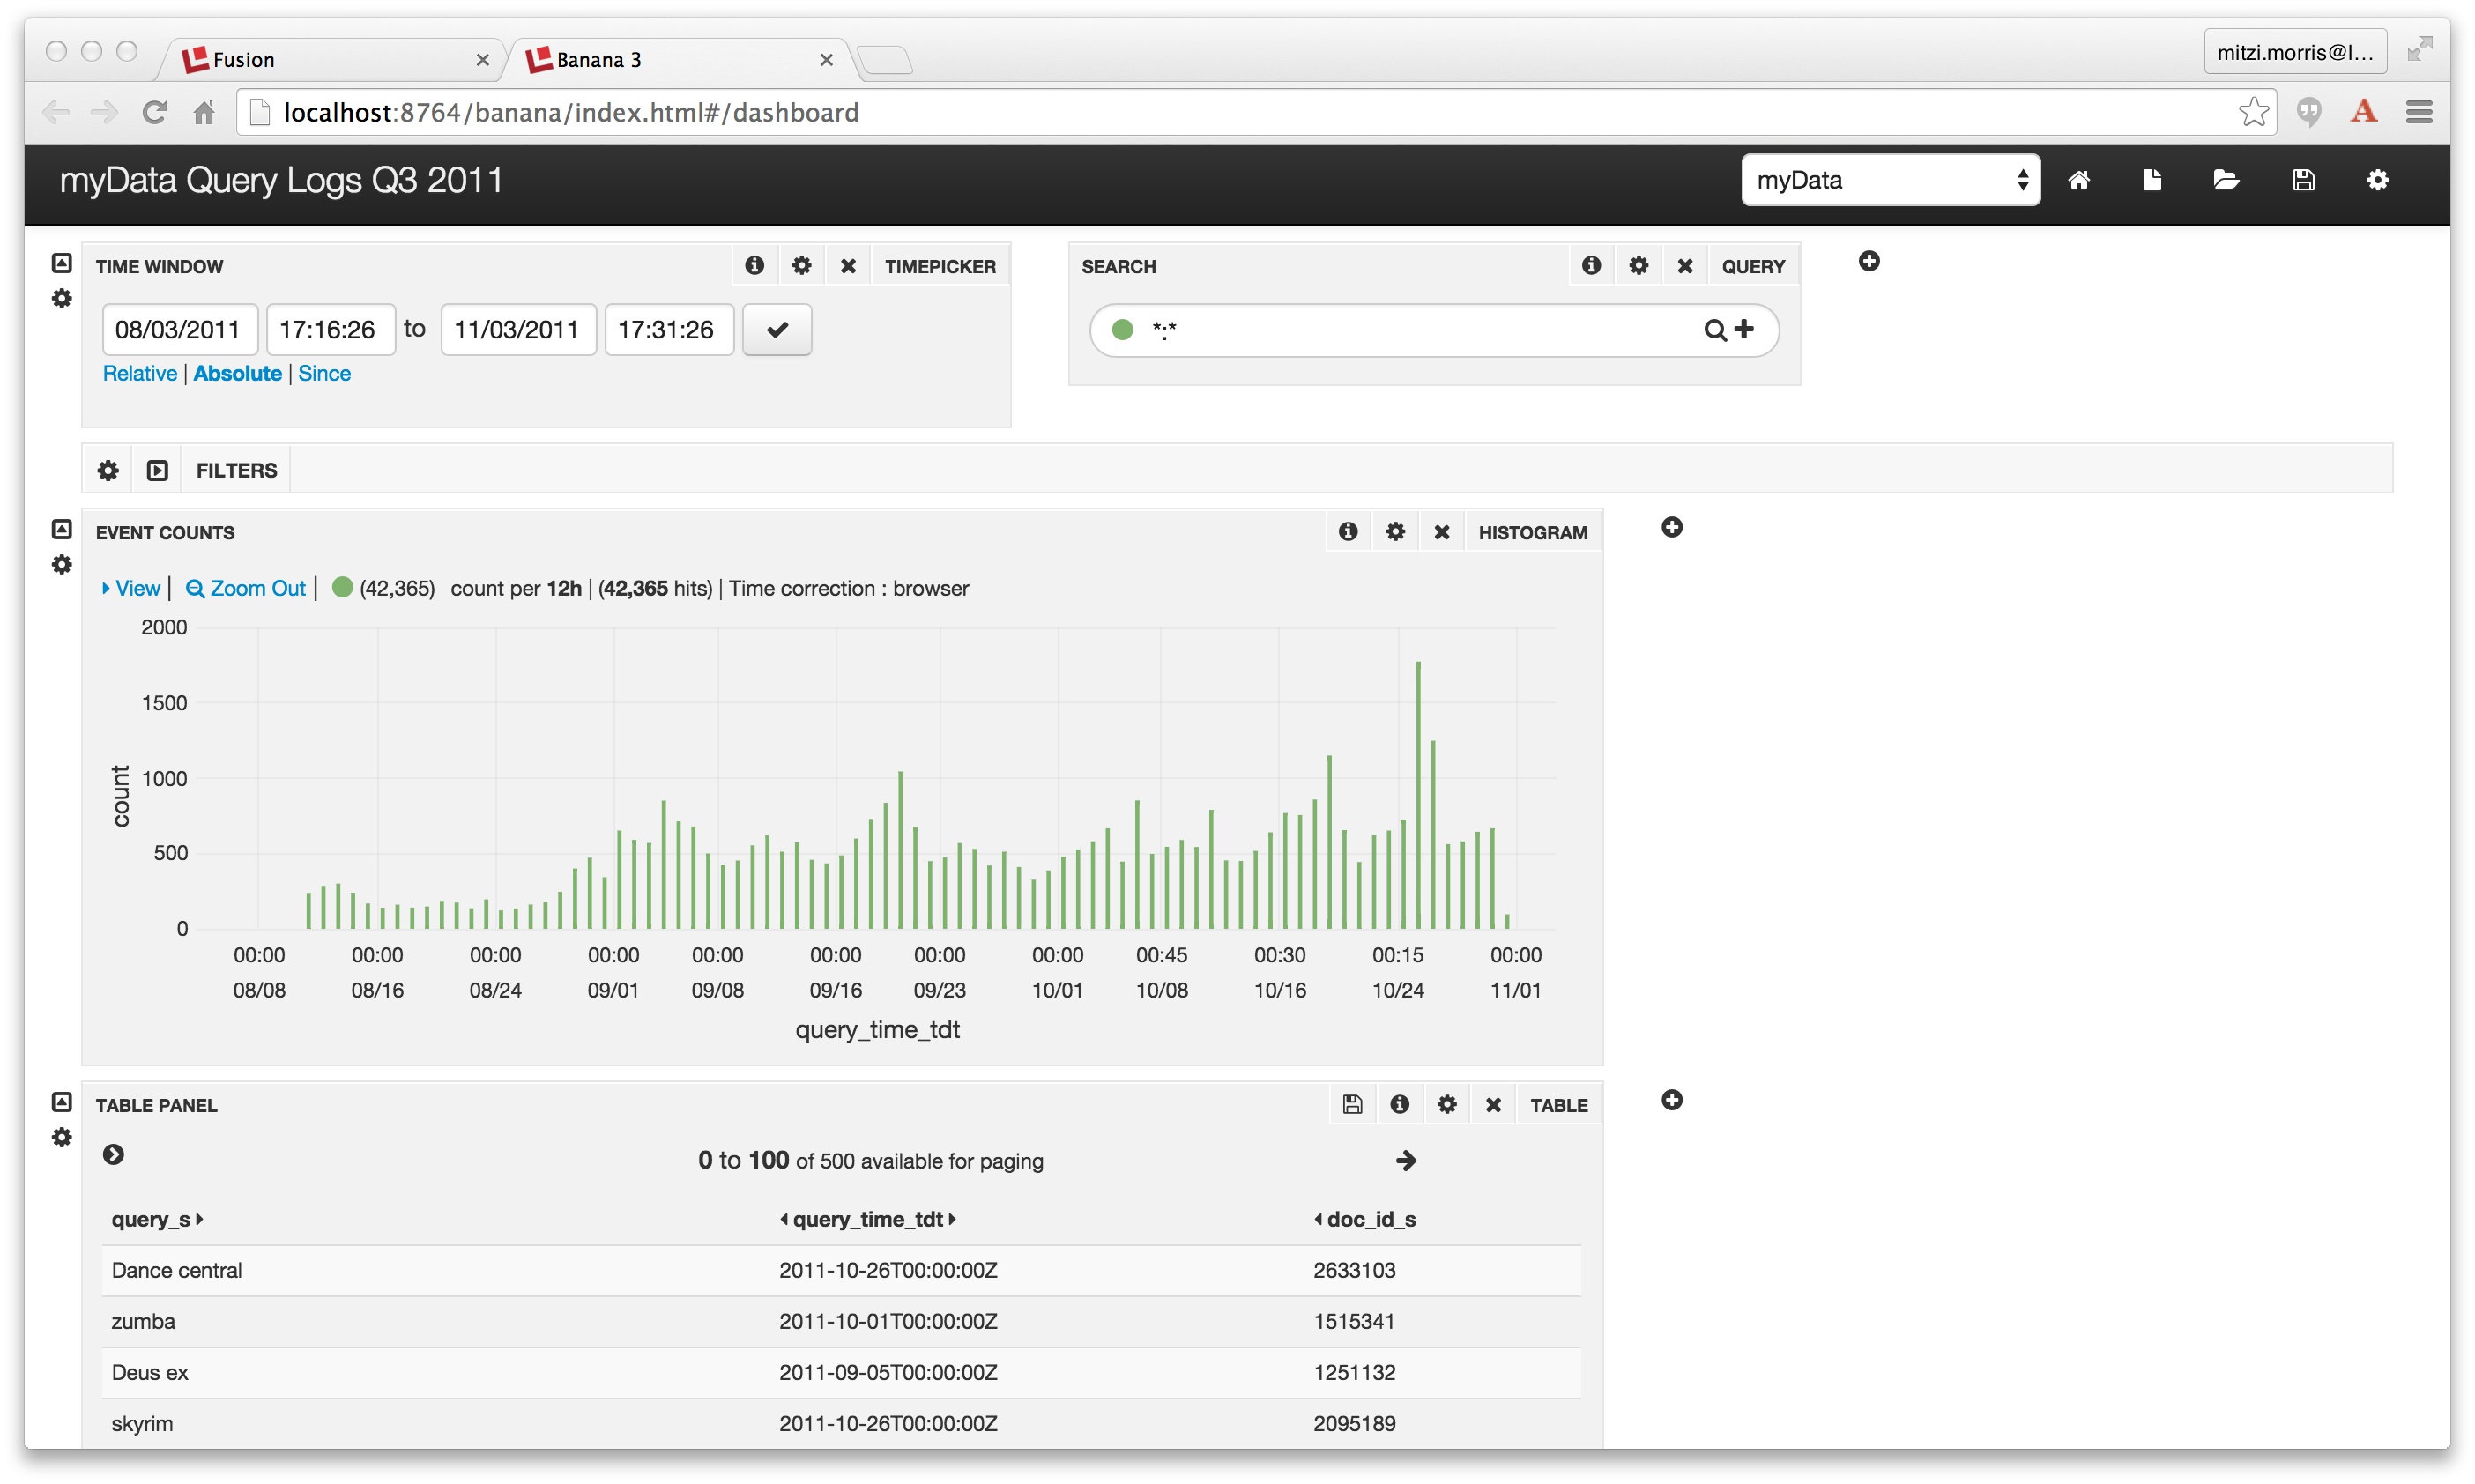
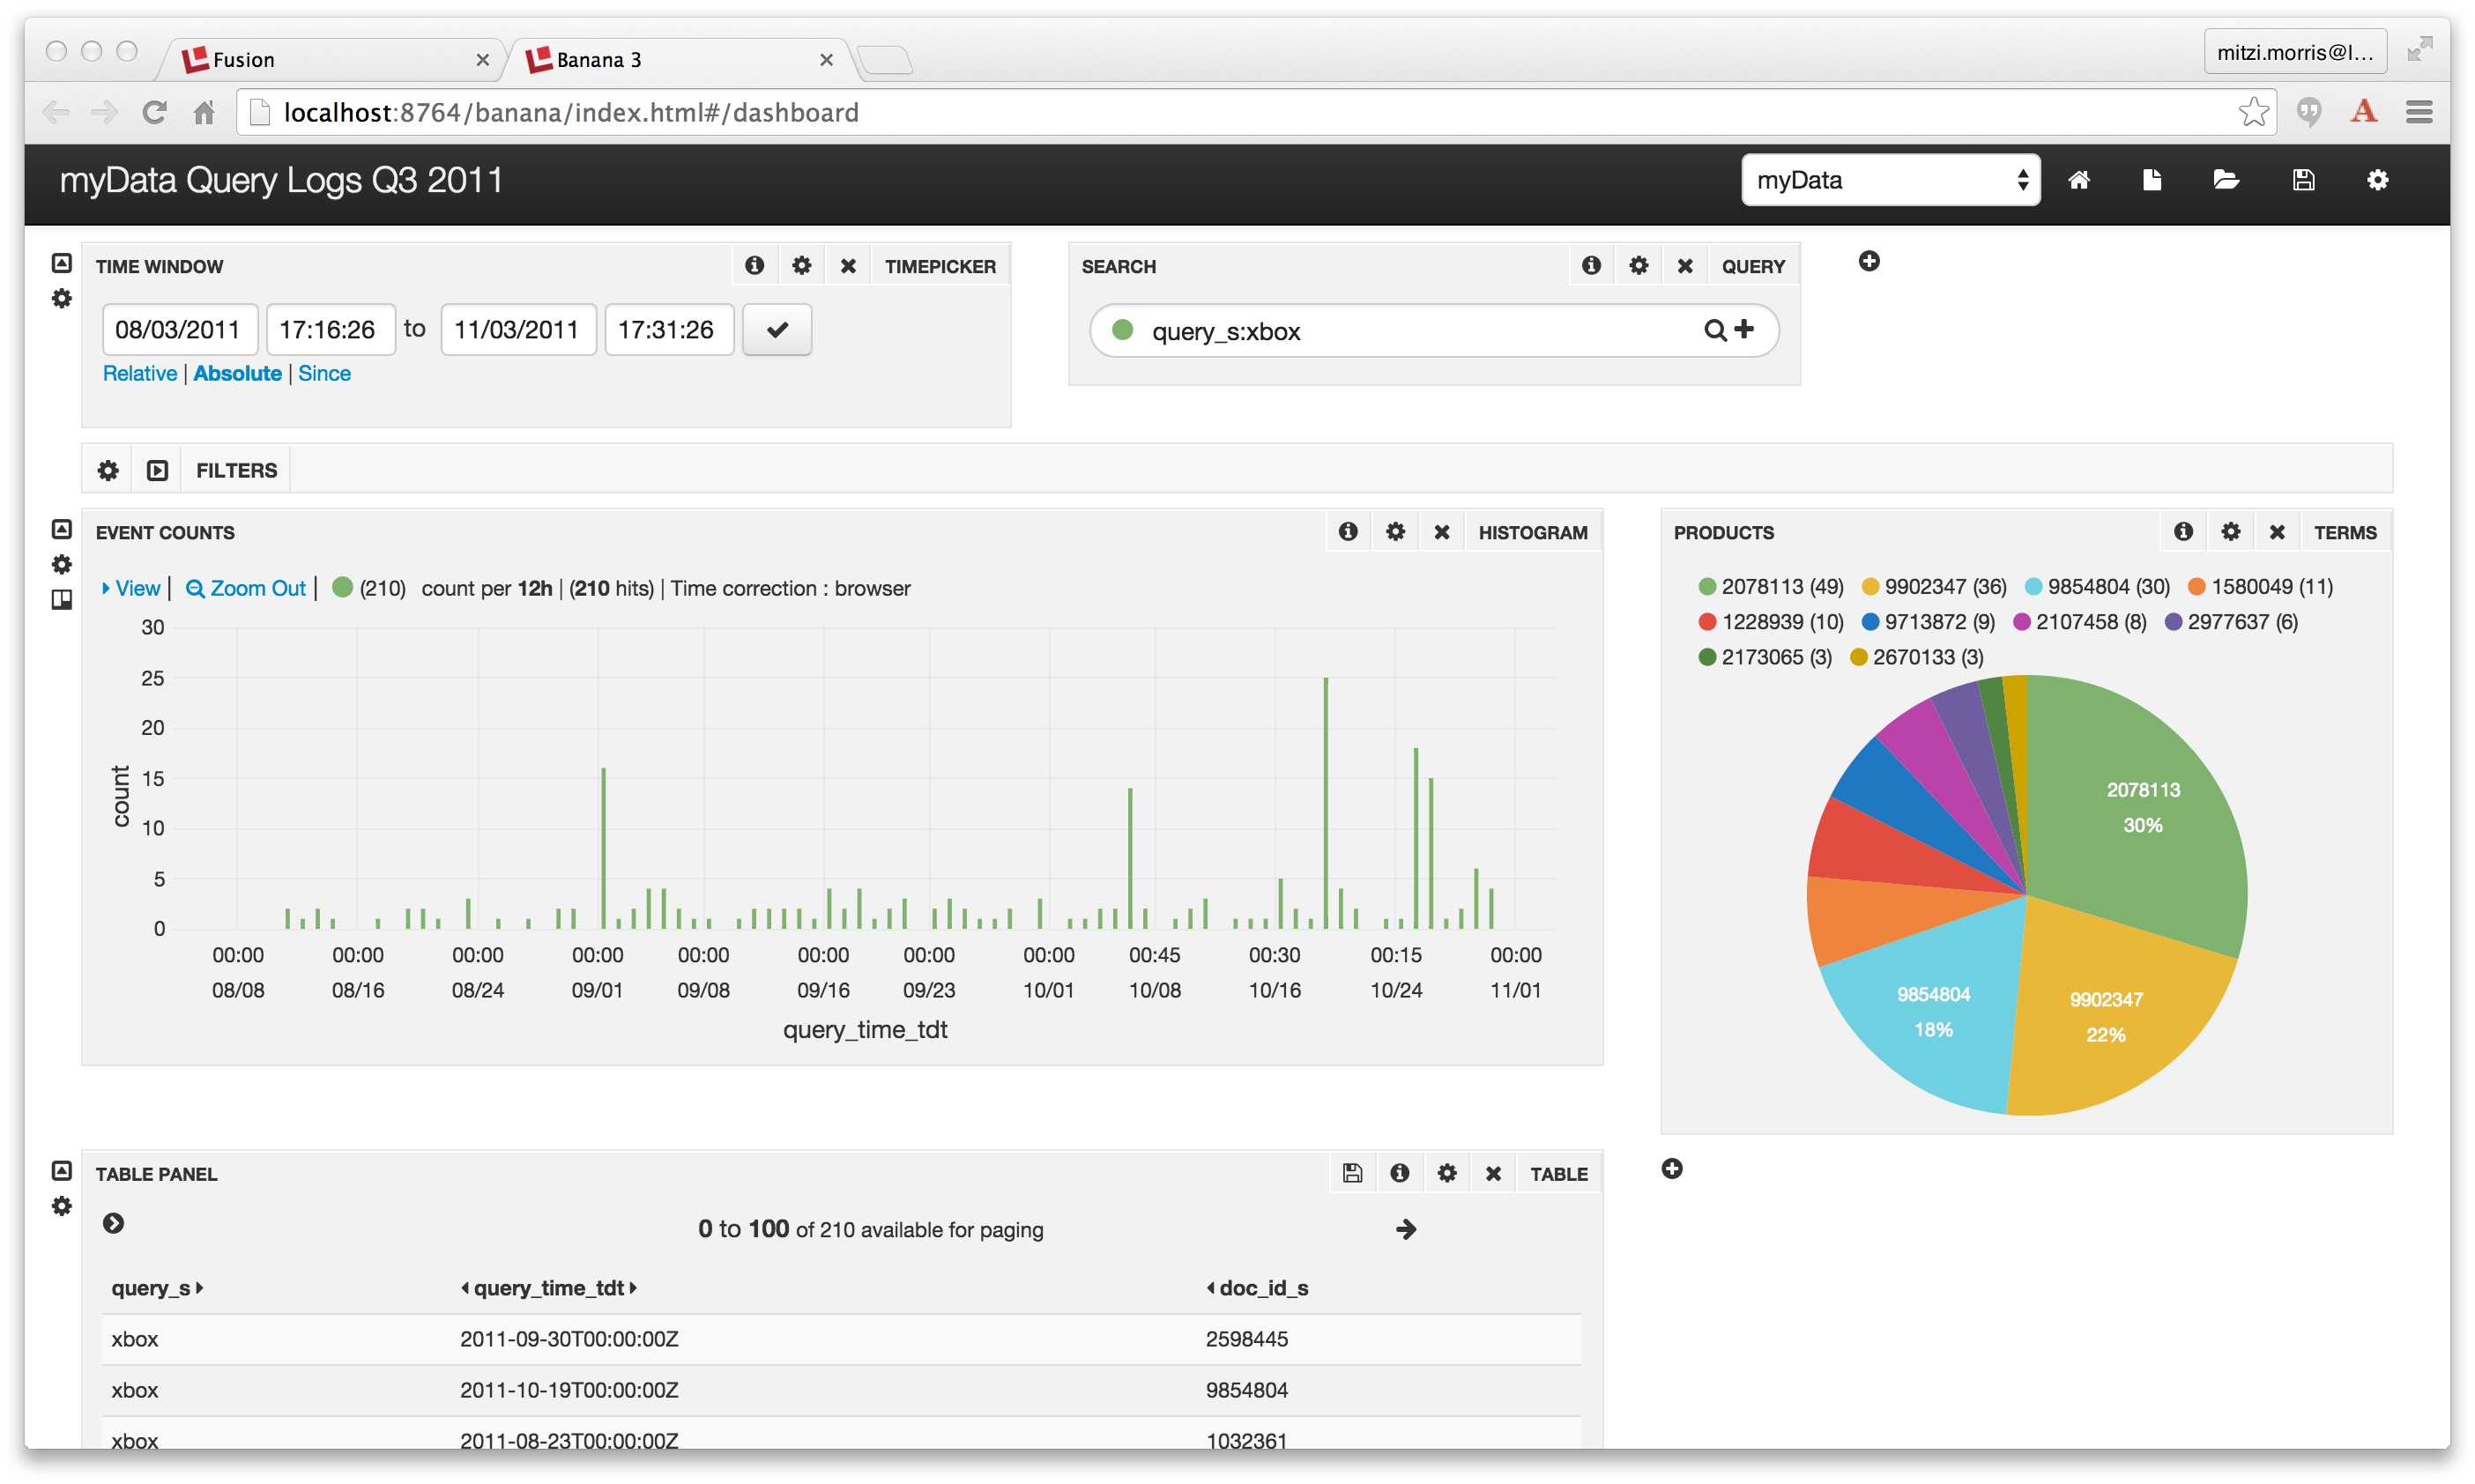
Every widget on the page has its own gear-shaped configuration icon as well as an show/hide control. Clicking on the configuration icon opens a Settings panel with a set of controls appropriate to that widget. After changing the dashboard title, collapsing the 2nd row of the display and resing the 3rd and 4th rows, the dashboard display looks like this:
Dashboards are organized into rows. In order to add a new display to a dashboard, you choose the row you want to add that display to. This opens the Row Settings panel, which allows you to rearrange and add to the displays on that row:
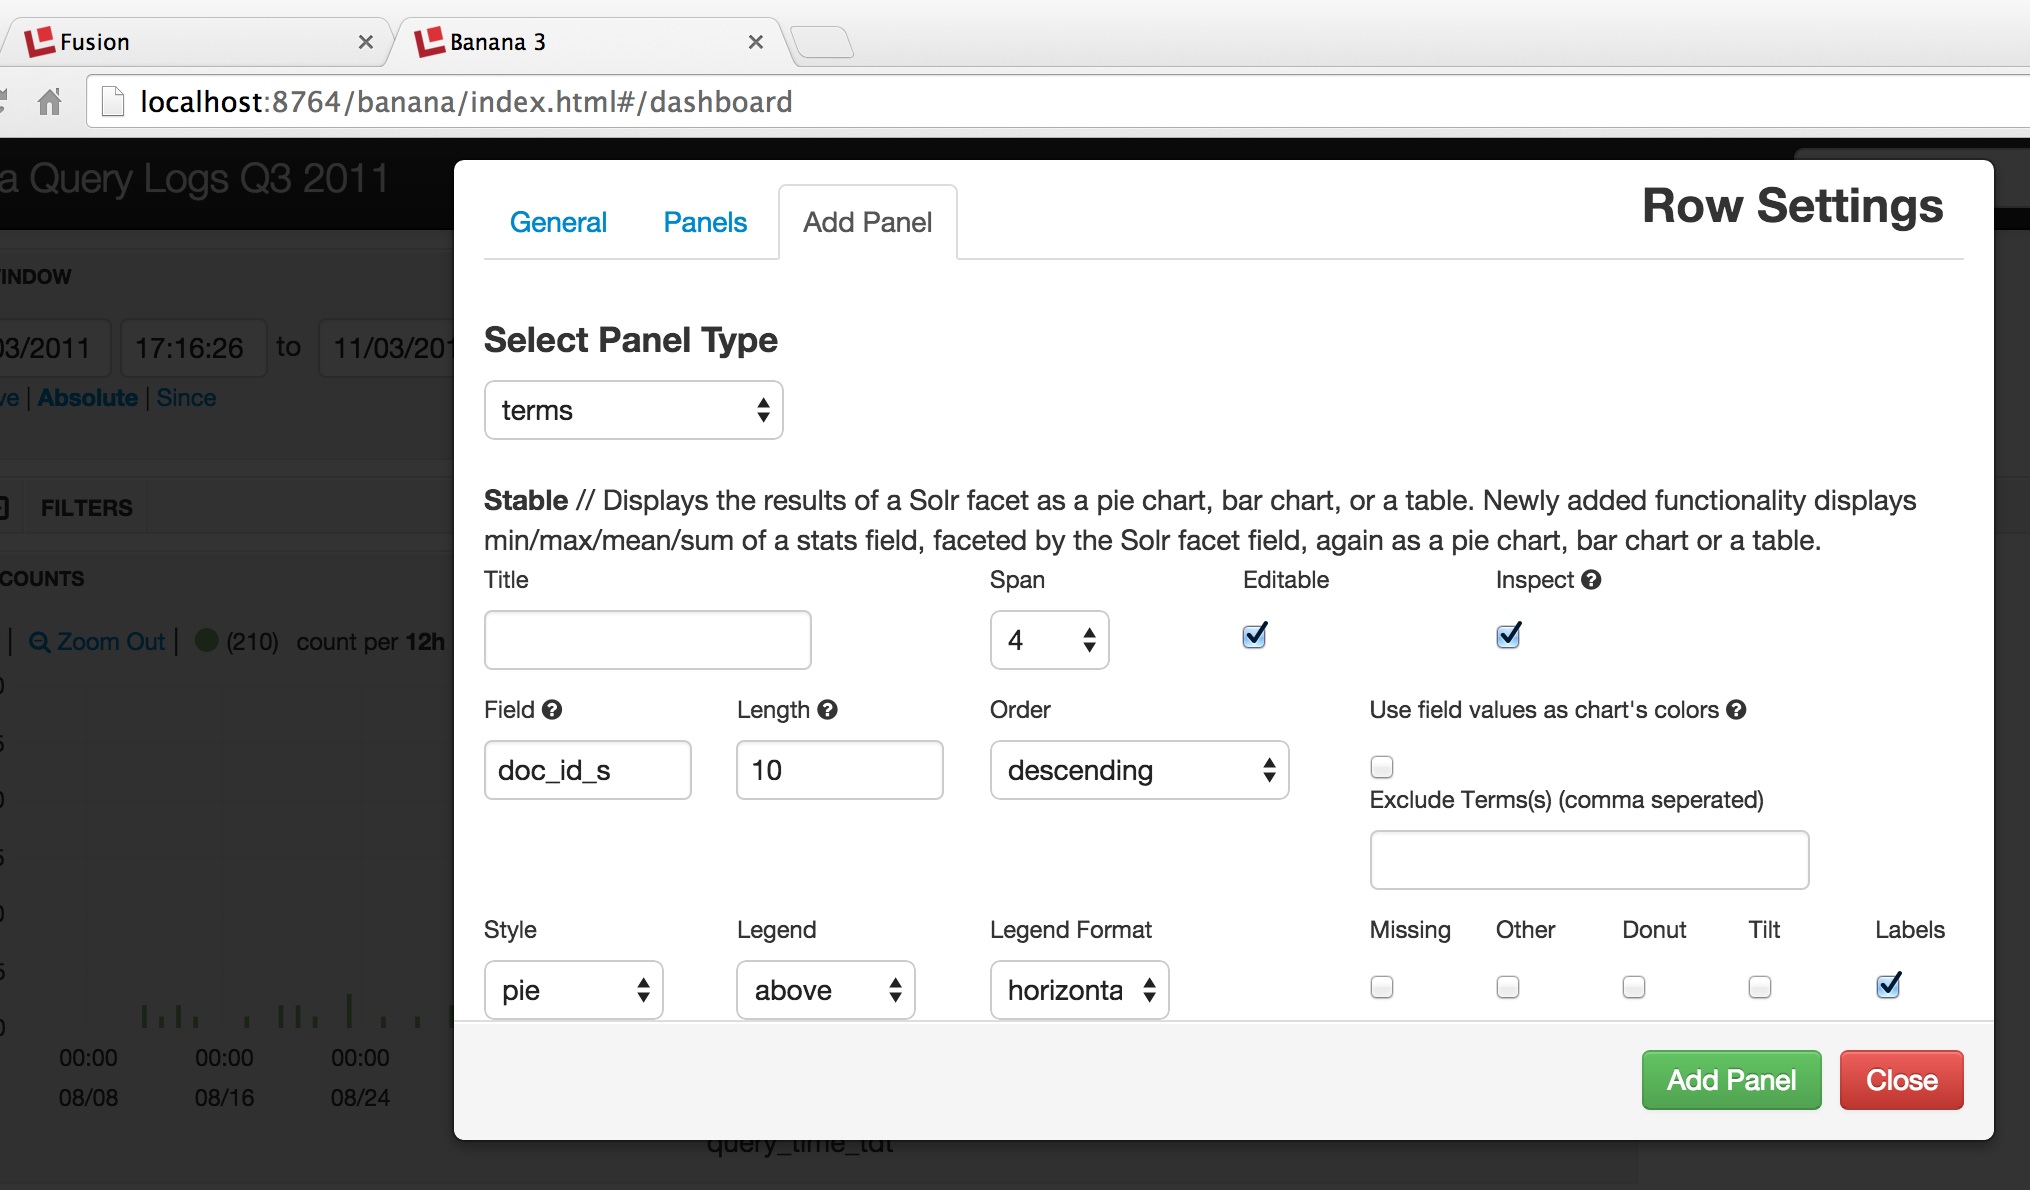
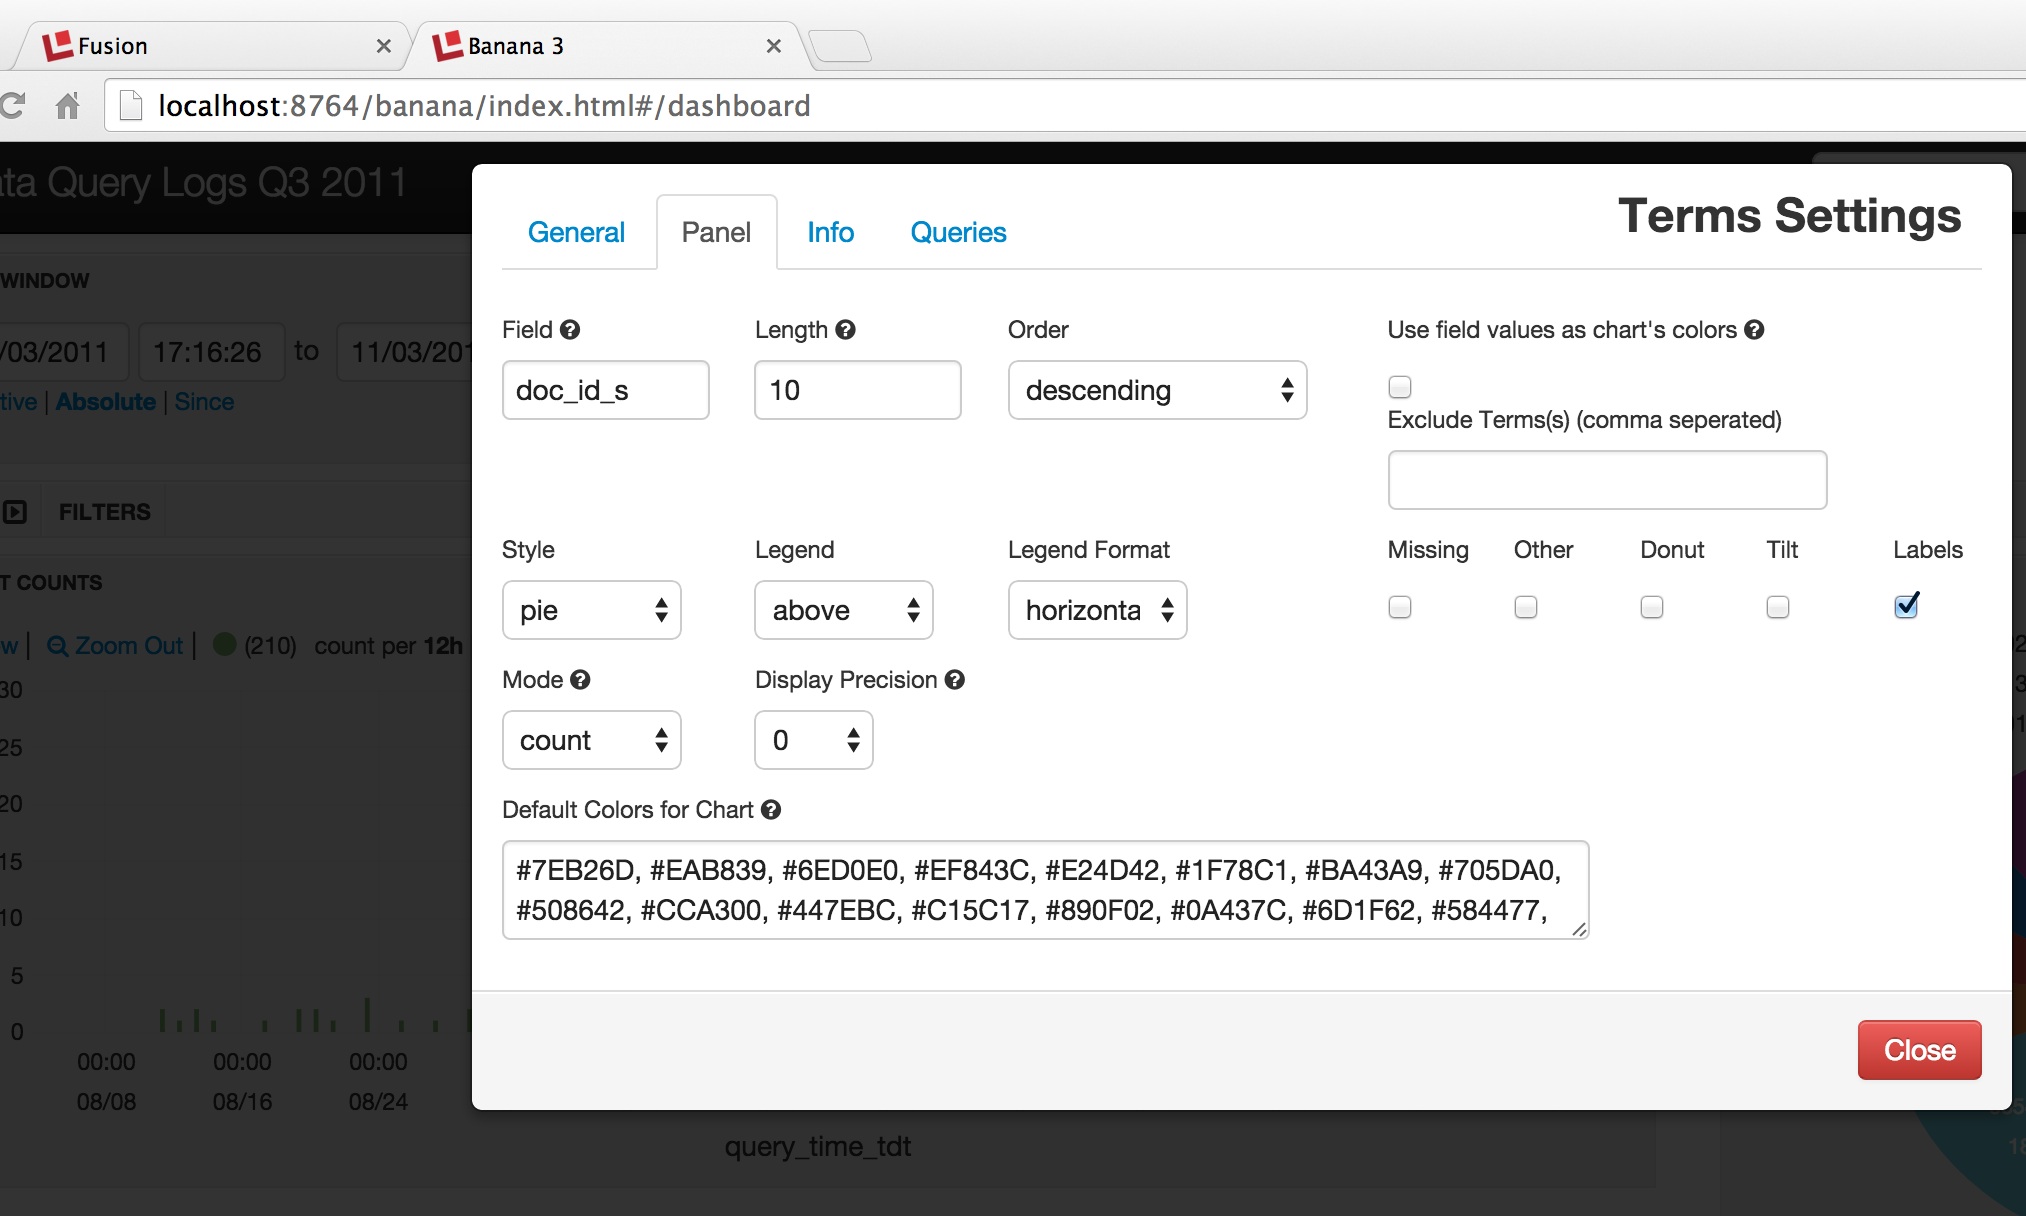
In the above screenshot, we choose to add a “terms” panel, which provides a visual display over the facet counts returned by a Solr facet query. The following screenshot shows how to configure the facet information as a piechart:
Once this configuration is in place, the Dashboard display includes a pie chart showing the results by field “doc_id_s” (note that this is an item id from an external source, not a Solr document id) for the results of running a dashboard search over the query string “xbox”:
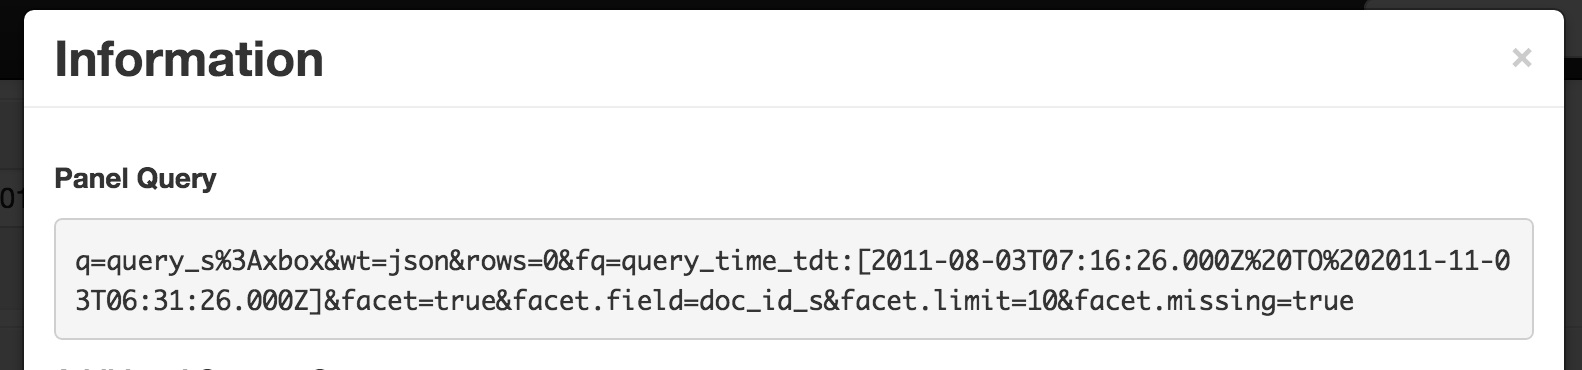
To better understand the data display for any panel, click on that panels “info” icon. This displays the Solr query which used to populate that panel:
You can save your dashboard configuration, you can extend it, in sum, using Fusion, you get your logfile data, your way.
Go Faster! Webinar: Faster Log Indexing with Fusion
Webinar: Faster Log Indexing with Fusion
Date: Thursday, April 23, 2015
Time: 11:00 am Pacific Daylight Time
Join Lucidworks senior engineer and Solr committer Timothy Potter for a look at our Fusion-based indexing solution optimized for Solr deployments with over 1 billion log events per month.
*dare to learn new things, dare to be a noob
LEARN MORE
Contact us today to learn how Lucidworks can help your team create powerful search and discovery applications for your customers and employees.