Introducing the Solr Scale Toolkit

SolrCloud is a set of features in Apache Solr that enable elastic scaling of distributed search indexes using sharding and replication. One of the hurdles to adopting SolrCloud has been the lack of tools for deploying and managing a SolrCloud cluster. In this post, I introduce the Solr Scale Toolkit, an open-source project sponsored by Lucidworks (lucidworksde.wpenginepowered.com), which provides tools and guidance for deploying and managing SolrCloud in cloud-based platforms such as Amazon EC2. In the last section, I use the toolkit to run some performance benchmarks against Solr 4.8.1 to see just how “scalable” Solr really is.
Motivation
When you download a recent release of Solr (4.8.1 is the latest at the time of this writing), it’s actually quite easy to get a SolrCloud cluster running on your local workstation. Solr allows you to start an embedded ZooKeeper instance to enable “cloud” mode using a simple command-line option: -DzkRun. If you’ve not done this before, I recommend following the instructions provided by the Solr Reference Guide: https://cwiki.apache.org
Once you’ve worked through the out-of-the-box experience with SolrCloud, you quickly realize you need tools to help you automate deployment and system administration tasks across multiple servers. Moreover, once you get a well-configured cluster running, there are ongoing system maintenance tasks that also should be automated, such as doing rolling restarts, performing off-site backups, or simply trying to find an error message across multiple log files on different servers.
Until now, most organizations had to integrate SolrCloud operations into an existing environment using tools like Chef or Puppet. While those are still valid approaches, the Solr Scale Toolkit provides a simple, Python-based solution that is easy to install and use to manage SolrCloud. In the remaining sections of this post, I walk you through some of the key features of the toolkit and encourage you to follow along. To begin there’s a little setup that is required to use the toolkit.
Installation and Setup
There are three basic steps to get started using the Solr Scale Toolkit on your local workstation:
- Setup Amazon Web Services (AWS) account and configure a keypair for accessing instances from SSH
- Install Python dependencies
- Clone the Solr Scale Toolkit from github and build the project using Maven
Setup Amazon Account
First, you will need an Amazon Web Services account. If you don’t have an Amazon AWS account, you’ll need to set one up before using the Solr Scale Toolkit, see: http://docs.aws.amazon.com
tip: The Solr Scale Toolkit only works with Linux in Amazon Web Services for now, but we plan to support other cloud providers in the near future by using the Apache libcloud project. https://libcloud.apache.org/
The toolkit requires a few setup tasks that you can perform in the AWS console. First, you need to setup a security group named solr-scale-tk. At a minimum you should allow TCP traffic to ports: 8983-8985, SSH (22), and 2181 (ZooKeeper). Of course, it is your responsibility to review the security configuration of your cluster and lock it down appropriately. The initial settings are just to help you get started using the toolkit.
You’ll also need to create an keypair named solr-scale-tk. After downloading the keypair file (solr-scale-tk.pem), save it to ~/.ssh/ and change permissions using:
chmod 600 ~/.ssh/solr-scale-tk.pem
Python Dependencies
You’ll need Python 2.7.x running on your local workstation. To verify the version of Python you’re running, open a command-line shell and do: python –version. On my Mac, the output is:
[~]$ python --version
Python 2.7.2
If you don’t have Python available, please refer to this page for assistance on getting setup for your specific operating system. https://www.python.org
The Solr Scale Toolkit depends on Fabric, which is a Python-based tool that streamlines the use of SSH for application deployment or systems administration tasks. Please refer http://fabric.readthedocs.org
After installing Fabric, you need to install the boto Python library for working with Amazon Web Services. In most cases, you can do this using pip install boto, but please refer to https://github.com
cat ~/.boto
[Credentials]
aws_access_key_id = YOUR_ACCESS_KEY_HERE
aws_secret_access_key = YOUR_SECRET_KEY_HERE
For more information about Amazon access keys, please see: http://docs.aws.amazon.com
Next, clone the pysolr project from github and install it using:
git clone https://github.com/toastdriven /pysolr.git cd pysolr sudo python setup.py install
The Solr Scale Toolkit uses pysolr to perform basic operations like queries and commits using the Solr HTTP API. If you don’t have git installed, please refer to: https://help.github.com
Clone the Solr Scale Toolkit github project
Now that you have your Amazon account and Python dependencies setup correctly, you are ready to setup the Solr Scale Toolkit.
Clone the project from github: https://github.com
After cloning, change into the solr-scale-tk directory and do: fab -l
You should see a list of available Fabric commands provided by the toolkit.
Build the Solr Scale Toolkit JAR file using: mvn clean package.
If you don’t have Maven installed, please see: http://maven.apache.org
Whew! You are now ready to use the Solr Scale Toolkit to deploy and manage a SolrCloud cluster.
Launching Instances
One of the most important tasks when planning to use SolrCloud is to determine how many servers you need to support your index(es). Unfortunately, there’s not a simple formula for determining this because there are too many variables involved. However, most experienced SolrCloud users do agree that the only way to determine computing resources for your production cluster is to test with your own data and queries. So for this blog, I’m going to demonstrate how to provision the computing resources for a small cluster but you should know that the same process works for larger clusters. In fact, the toolkit was developed to enable large-scale testing of SolrCloud. I leave it as an exercise for the reader to do their own cluster-size planning
.
For this post, let’s plan to launch a SolrCloud cluster across two m3.xlarge instances with three m3.medium instances for hosting a ZooKeeper ensemble. We’ll plan to run two Solr nodes per instance, giving us a total of 4 Solr nodes in our cluster. Each Solr node will have a dedicated SSD.
The following diagram depicts our planned cluster.

One of the key design decisions made for the toolkit early on was to use a custom AMI. Currently, the AMI is based on RedHat Enterprise Linux 6.4. The custom AMI has Java, Solr 4.8.1, ZooKeeper 3.4.6, as well as a few additional services installed, such as collectd. The idea behind using a custom AMI is to avoid having to setup core services like Java every time you launch a new instance. If you’re not a fan of RedHat, don’t fret as we’re planning to support additional flavors of Linux, such as Debian, in the near future.
When provisioning, the user really only needs to worry about the instance type and number of instances to start. However, behind the scenes, there are a number of other concerns, such as configuring block device mappings and then mounting all available instance stores. Don’t worry if you don’t know much about block device mappings, as the toolkit handles all the details for you. For example, m3.xlarge instances have two 40 GB SSD instance stores available; the toolkit will create an ext3 filesystem on each drive and mount them on /vol0 and /vol1 respectively.
ZooKeeper Ensemble
ZooKeeper is a distributed coordination service that provides centralized configuration, cluster state management, and leader election for SolrCloud. In production you must run at least three ZooKeeper servers in a cluster called an ensemble to achieve high-availability. To begin, let’s setup our ZooKeeper ensemble on three m3.medium instances using:
fab new_zk_ensemble:zk1
The main thing that should stand out to you from this command is the zk1 parameter, which is the cluster ID I’m giving to this group of three m3.medium instances. The toolkit works off the concept of a named “cluster” so that you don’t need to worry about hostnames or IP addresses; the framework knows how to lookup hosts for a specific cluster. Behind the scenes, this uses Amazon tags to find instances and collect their host names.
You might be wondering why I didn’t specify the instance type and count. Let’s take a look at the documentation for the new_zk_ensemble command using:
fab -d new_zk_ensemble
Displaying detailed information for task 'new_zk_ensemble':
   Configures, starts, and checks the health of a ZooKeeper
      ensemble on one or more nodes in a cluster.
Arg Usage:
cluster (str): Cluster ID used to identify the ZooKeeper ensemble created by this command.
n (int, optional): Size of the cluster.
instance_type (str, optional):
Returns:
zkHosts: List of ZooKeeper hosts for the ensemble.
Arguments: cluster, n=3, instance_type=’m3.medium’
As you can see from this documentation, the default values for the instance type and count are m3.medium and 3 respectively. You should also remember that you can do fab -d <command> to get usage information for any command in the toolkit.
Behind the scenes, the new_zk_ensemble command performs the following operations:
- Provision three m3.medium instances in EC2 using the custom Solr Scale Toolkit AMI. The toolkit verifies SSH connectivity to each instance and tags each instance with the cluster=zk1 tag.
- Configures a 3-node ZooKeeper ensemble with client port 2181. Each ZooKeeper server is configured to use the instance store mounted on /vol0. The toolkit verifies that ZooKeeper is healthy before declaring success.
Running the new_zk_ensemble command is equivalent to running the following two Fabric commands:
fab new_ec2_instances:zk1,n=3,instance_type=m3.medium
fab setup_zk_ensemble:zk1
When you execute on of the toolkit’s Fabric commands, there are a number of key concepts at work, including:
- Much of what the toolkit does is graceful handling of waits and status checking, so you’ll see several messages about waiting and checking for various outcomes.
- For the most part, parameters have sensible defaults. Of course, parameters like number of nodes to launch don’t have a sensible default, so you usually have to specify sizing type parameters.
- Any commands that begin with the “new_” prefix imply that they provision nodes in EC2, whereas commands that being with the “setup_” prefix assume the nodes are already provisioned.
In general, the toolkit breaks tasks into 2 phases:
- provisioning instances of our AMI, and
- configuring, starting, and checking services on the provisioned instances
This two-step process implies that if step #1 completes successfully but an error / problem occurs in #2, that the nodes have already been provisioned and that you should not re-provision nodes. Let’s look at an example to make sure this is clear.
Imagine you get an error when running the new_zk_ensemble command. First you need to take note as to whether nodes have been provisioned. You will see green informational message about this in the console, such as:
** 3 EC2 instances have been provisioned **
If you see a message like this, then you know step 1 was successful and you only need to worry about correcting the problem and re-run step 2, which in our example would be running the setup action. However, it is generally safe to just re-run the command (e.g. new_zk_ensemble) with the same cluster name as the framework will notice that the nodes are already provisioned and simply prompt you on whether it should re-use them. In most cases, the answer is Yes.
Now that we have a ZooKeeper ensemble running, we can deploy a new SolrCloud cluster.
Launch SolrCloud cluster
As discussed above, we’re going to launch a new SolrCloud cluster on two m3.xlarge instances and run two Solr nodes per instance. Each Solr node should use one of the SSD instance stores provided for m3.xlarge instances.
Before we launch the Solr nodes, let’s review some important terms used by the Solr Scale Toolkit:
- Instance (aka machine): Virtual machine running in a cloud-provider’s data center, such as EC2
- Node: JVM process bound to a specific port on an instance; hosts the Solr web application running in Jetty
- Collection: Search index distributed across multiple nodes; each collection has a name, shard count, and replication factor
- Replication Factor: Number of copies of a document in a collection, e.g. replication factor of 3 for a collection with 100M documents means that there are 300M documents total across all replicas.
- Shard: Logical slice of a collection; each shard has a name, hash range, leader, and replication factor. Documents are assigned to one and only one shard per collection using a document routing strategy.
- Replica: Solr index that hosts a copy of a shard in a col
lection; behind the scenes, each replica is implemented as a Solr core. Example: a collection with 20 shards and replication factor of 2 in a 10 node cluster will result in 4 Solr cores per node. - Leader: Replica in a shard that assumes special duties needed to support distributed indexing in Solr; each shard has one and only one leader at any time and leaders are elected automatically using ZooKeeper. In general, you should not care about which replicas are elected as the leader.
The following diagram depicts how each instance in Amazon will be configured by the Solr Scale Toolkit:

As depicted in the diagram, there are two Solr JVM processes running on ports 8984 and 8985. Each process has a dedicated 40 GB SSD drive. Indexes are configured to use the MMapDirectory implementation which uses memory-mapped I/O to load index data structures into the OS cache. Each JVM process is configured with a conservative max heap setting in order to give as much memory to the OS cache as possible.
Let’s launch a new SolrCloud cluster named “cloud1” using:
fab new_solrcloud:cloud1,n=2,zk=zk1,nodesPerHost=2,instance_type=m3.xlarge
Most of that should be pretty self-explanatory. The zk=zk1 tells the Solr nodes the address of the ZooKeeper ensemble; recall that we named the ensemble: zk1.
If this goes well, you’ll see messages similar to the following:
4 Solr servers are up!
Successfully launched new SolrCloud cluster cloud1; visit: http://<host>:8984/solr/#/
One of the design decisions in the toolkit was to use a BASH script to control each Solr node on an instance. In other words, Fabric commands delegate some of the work for managing Solr to a local BASH script on each instance, see: /home/ec2-user/cloud/solr-ctl.sh.
The solr-ctl.sh script’s main responsibility is to start Solr with the correct JVM options and system properties. Here’s an example of the start command used to start a Solr node in cloud mode; don’t worry I don’t expect you to care much about the details in this command, I’m just including it here to give you a feel for what the solr-ctl.sh script does:
/home/ec2-user/jdk1.7.0_25/bin/java -Xss256k -server -XX:+UseG1GC -XX:MaxGCPauseMillis=5000 -XX:+HeapDumpOnOutOfMemoryError -DzkClientTimeout=5000 -verbose:gc -XX:+PrintHeapAtGC -XX:+PrintGCDetails -XX:+PrintGCTimeStamps -XX:+PrintTenuringDistribution -Xms3g -Xmx3g -XX:MaxPermSize=512m -XX:PermSize=256m -Djava.net.preferIPv4Stack=true -Dcom.sun.management.jmxremote -Dcom.sun.management.jmxremote.local.only=false -Dcom.sun.management.jmxremote.ssl=false -Dcom.sun.management.jmxremote.authenticate=false -Djava.rmi.server.hostname=ec2-??-##-??-##.compute-1.amazonaws.com -Dcom.sun.management.jmxremote.port=1084 -Dcom.sun.management.jmxremote.rmi.port=1084 -Xloggc:/home/ec2-user/solr-4.7.1/cloud84/logs/gc.log -XX:OnOutOfMemoryError=/home/ec2-user/cloud/oom_solr.sh 84 %p -Dlog4j.debug -Dhost=ec2-??-##-??-##.compute-1.amazonaws.com -Dlog4j.configuration=file:////home/ec2-user/cloud/log4j.properties -DzkHost=ec2-??-##-??-##.compute-1.amazonaws.com:2181,...:2181/cloud1 -DSTOP.PORT=7984 -DSTOP.KEY=key -Djetty.port=8984 -Dsolr.solr.home=/home/ec2-user/solr-4.7.1/cloud84/solr -Duser.timezone=UTC -jar start.jar
Hopefully it should be clear from this command that the toolkit is saving you some work by starting Solr using options based best practices learned by the Solr community. For instance, notice that this command registers an OutOfMemory handler script which ensures the process gets killed so that you don’t have zombie nodes in your cluster.
We’ll get to creating a collection and indexing some documents in a moment, but first, I’d like to cover an optional, but very useful feature of the Solr Scale Toolkit: integration with SiLK for monitoring and log aggregation.
Meta Node
Every Solr node in the cluster is configured to log to logs/solr.log. However, it would be nice if all warning and error messages from all nodes were collected in the same location to help our system administrators identify and troubleshoot issues in the cluster. In addition, you probably want to keep a close eye on key system metrics such as CPU load, network I/O, and memory. The toolkit provides support for these common requirements by integrating with Lucidworks’ SiLK solution, see: https://de.lucidworks.com
SiLK: Solr integrated with Logstash and Kibana
SiLK gives users the power to perform ad-hoc search and analysis of massive amounts of multi-structured and time series data. Users can swiftly transform their findings into visualizations and dashboards, which can easily be shared across the organization.
The following diagram depicts how SiLK is integrated into the Solr Scale Toolkit:

Looking at the diagram from left-to-right, each EC2 instance hosts one or more Solr nodes. Log4J is configured to send all log messages of severity warning or greater to SiLK using the AMQP Log4J appender. In addition, each EC2 instance runs the collectd client agent to collect system metrics (e.g. CPU load) and send them to the collectd plugin in Logstash4Solr. Log messages from our SolrCloud nodes and system metrics are indexed into Solr on the meta node. Each document has an event_timestamp field to support time-series analysis. You can build a cool dashboard using the banana UI.
To launch a meta node, do the following:
fab new_meta_node:meta1
The command will write the banana dashboard URL to the console, such as:
Banana UI @ http://ec2-##-##-###-###.compute-1.amazonaws.com:8983/banana
Once the meta node is up-and-running, you need to tell the SolrCloud nodes to start sending log messages and collectd metrics to SiLK using:
fab attach_to_meta_node:cloud1,meta1
Navigate to the banana dashboard on the meta node and you should start to see collectd metrics (CPU load) for your Solr nodes.
Putting it all together
So now we have a 4-node SolrCloud cluster running in two EC2 instances, highly-available ZooKeeper ensemble, and meta node running SiLK, let’s see all this in action by creating a new collection, indexing some documents, and executing some queries.
First, let’s get an overview of all the instances we’re running by doing: fab mine
This should produce a nice report of which instances are running in which clusters, such as:
Finding instances tagged with username: thelabdude
*** user: thelabdude ***
{
 "meta1": [
   "ec2-54-84-??-??.compute-1.amazonaws.com: i-63c15040 (m3.large running for 0:44:05)"
 ],
 "zk1": [
   "ec2-54-86-??-??.compute-1.amazonaws.com: i-a535a386 (m3.medium running for 2:27:51)",
   "ec2-54-86-??-??.compute-1.amazonaws.com: i-a435a387 (m3.medium running for 2:27:51)",
   "ec2-54-86-??-??.compute-1.amazonaws.com: i-a635a385 (m3.medium running for 2:27:51)"
 ],
 "cloud1": [
   "ec2-54-84-??-??.compute-1.amazonaws.com: i-acdf4e
8f (m3.xlarge running for 0:48:19)",
   "ec2-54-85-??-??.compute-1.amazonaws.com: i-abdf4e88 (m3.xlarge running for 0:48:19)"
 ]
}
Behind the scenes, instances are tagged with your local username so that you can keep track of which instances you are running. If this is a shared account, you can also do fab mine:all to see all running instances for all users on the account.
Now let’s move on to creating a collection using:
fabnew_collection: cloud1, example1, rf=2,shards=2
This will create a new collection named example1 with 2 shards and replication factor of 2. At this point you can index your own data into the collection or to keep things simple, the toolkit includes an example SolrJ client application that indexes synthetic documents.
fab index_docs:cloud1, example1, 20000
Behind the scenes, this command uses the solr-scale-tk.jar file to index 20K synthetic documents into SolrCloud. This application serves as a good example of how to use the CloudSolrServer class in SolrJ for building client applications against SolrCloud. The command-line utility also serves as a starting point for building other Java-based client tools for SolrCloud, especially when a client application needs access to cluster metadata in ZooKeeper. If you’re interested in how this works, take a look at: https://github.com
Here is a screen shot of the banana dashboard after indexing.
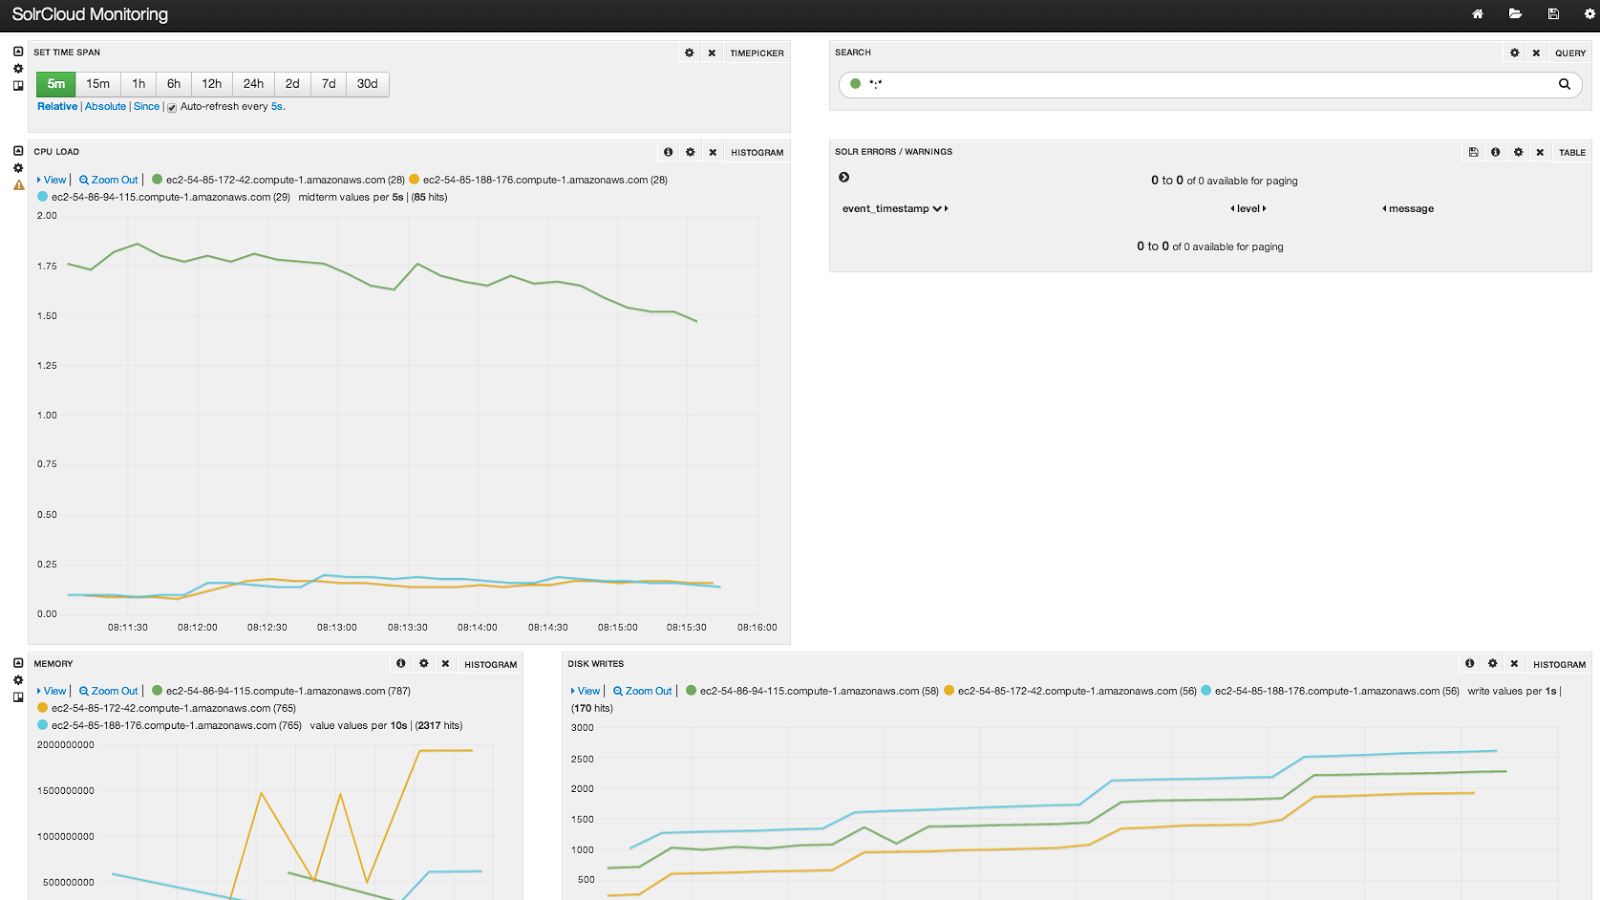
The node with the higher CPU load is the meta node, which hosts the collectd server, SiLK, and rabbitmq. Of course this is just an example of a simple banana dashboard; I encourage you to take the full tour of SiLK by visiting: https://de.lucidworks.com/lucidworks-silk/
Other Tasks
Once you have your cluster up-and-running, the toolkit also helps you perform routine maintenance tasks. Let’s tackle a few of these so you get a sense for what’s available. For a complete list of supported commands, execute: fab -l.
Deploy a configuration directory to ZooKeeper
Out-of-the-box, the example Solr configuration directory (example/solr/collection1/conf) is uploaded to ZooKeeper using the configuration name “cloud”. However, it’s quite common that you will have your own Solr configuration files and settings. The toolkit provides a command to upload a configuration directory from your location workstation to ZooKeeper. For example, if the configuration directory I want to upload is in /tmp/solr_conf, then I can do:
fab
The third argument is the name of the configuration in ZooKeeper. You can use this name whenever creating a new collection, such as:
fab
You should also notice a pattern with the Fabric commands–they all use the cluster ID as the first parameter, such as “cloud1”.
Build Solr locally and patch remote
Before I wrap-up, let’s see one more useful task for patching your Solr servers. Imagine that you applied a patch for an issue to a local build of Solr 4.8.1 and you now need to publish the patch to your cluster in EC2. Assume the local Solr build is in /tmp
fab
This will upload the core and solrj jar files from your local workstation to the first node in the cluster and then scp them to all other nodes, which is preferable to trying to upload them to all servers as copying from one server to another in Amazon is very fast. After the JARs are updated, a rolling restart is performed to apply the update.
Let’s actually see some scale already!
Finally, let’s put the toolkit to work to see how well Solr performs and scales. When constructing a performance / scalability test, there are three things we have to consider. First, we need a client application that can drive sufficient traffic to Solr. All too often, I see users complaining about Solr performance when in reality, their client application isn’t supplying enough load and the Solr servers are snoozing in the background. For this, I’m going to use Amazon Elastic MapReduce, which allows me to ramp up as many client applications as I want.
Second, I need a data set that is somewhat realistic. For this I used the PigMix data generator framework to create 130M synthetic documents that are about 1K in size and contain a mix of randomly generated numeric, date/time, boolean, string, and English text fields; the English text fields follow a Zipf distribution. The dataset is stored in S3 so I can load it on-demand from Elastic MapReduce and run an indexing performance test. Generating text that follows a Zipf distribution is actually quite slow for benchmarking purposes, so pre-computing the data ahead of time means our performance tests are not impacted by data generation costs.
Third, I need to ensure the network pipe into Solr from Elastic MapReduce is not constrained. In other words, I don’t want Solr waiting on the network for input during indexing. For this, I chose to use r3.2xlarge instance types with enhanced networking enabled and in an EC2 placement group; r3.2xlarge instances provide high I/O throughput (see: http://aws.amazon.com/about-aws/whats-new/2014/04/10/r3-announcing-the-next-generation-of-amazon-ec2-memory-optimized-instances/). On the Hadoop side, the network performance of m1.xlarge instances is pretty good (see: http://flux7.com
As for getting docs into Solr from Hadoop, I’m using a simple Pig script (available in the solr-scale-toolkit project) that writes to Solr using Lucidworks’ SolrStoreFunc. The data set is publicly available on S3 from: s3://solr-scale-tk
To start, I wanted to get an idea of raw indexing performance without replication so I indexed into a 10×1 collection on 10 nodes, which took just over 31 minutes or 68,783 docs per second using 32 reducers and 1,000 document batch sizes. Next, I increased the number of reducers to 48 with a batch size of 1,500, which resulted in 73,780 docs per second. Overall, GC activity remained stable and the CPUs still had plenty of capacity to support searches while indexing, see screen shot from VisualVM below. (NOTE: The big drop in heap size is probably left over from a previous test, the interesting bits are on the right of the drop in this graph).

Next, I wanted to understand the impact of replication, so I ran the same tests as before against a 10×2 collection (still on 10 nodes), which only achieved an average of 33,325 docs per second. Since each node is now hosting 2 Solr cores instead of one, the CPU utilization is much higher (see graph below). It’s likely that 48 indexing reducers is too much for this configuration as you wouldn’t expect replication to cause that much of a slowdown. So I tried with only 34 reducers and achieved 34,881 docs per second with the avg/max CPU utilization being lower to handle query execution. Lesson here is don’t overdo it on the indexing side, especially when using replication; more tests are needed to determine the optimal number of indexing clients and batch size.
Screen shot when indexing 10×2 with 48 reducers; avg. and max CPU are too high to support query execution (more is not always better).

Also, oversharding is a common strategy for scaling Solr so I chose to run the tests against a 20×1 and 20×2 collection, which yielded 101,404 and 40,536 respectively. Clearly, some amount of oversharding helps with performance, even when using replication. Solr seemed to have more capacity when running the 20 shard tests, so I increased the shard count to 30 on 10 nodes and results continued to improve: 121,495 for the 30×1 and 41,152 for 30×2. The 30×2 results make it pretty clear that using 60 reducers was probably too much as average CPU usage was 95% for the duration of the test and throughput only increased slightly over the 20×2 test.
Lastly, adding more nodes should lead to near linear scalability. For my next round of testing, I ran with 15×1 and 15×2 on 15 nodes. For the 15×1 collection, I achieved 117,541 docs per second with stable CPU (avg. around 50-60%, peak around 85%); this is a 59% increase in throughput for a 50% increase in node count; better than linear because I used more reducers (60 vs. 48) for my 15 node test given the increased capacity of the cluster. Finally, I ran a 30×1 test in the 15-node cluster and reached 157,195 docs/sec, which is truly impressive in my mind!
The following table summarizes the results of my testing:
| Cluster Size | Num Shards | Replication Factor | Reducers (clients) | Time (secs) | Docs / Second |
| 10 | 10 | 1 | 48 | 1762 | 73,780 |
| 10 | 10 | 2 | 34 | 3727 | 34,881 |
| 10 | 20 | 1 | 48 | 1282 | 101,404 |
| 10 | 20 | 2 | 34 | 3207 | 40,536 |
| 10 | 30 | 1 | 72 | 1070 | 121,495 |
| 10 | 30 | 2 | 60 | 3159 | 41,152 |
| 15 | 15 | 1 | 60 | 1106 | 117,541 |
| 15 | 15 | 2 | 42 | 2465 | 52,738 |
| 15 | 30 | 1 | 60 | 827 | 157,195 |
| 15 | 30 | 2 | 42 | 2129 | 61,062 |
There are a couple interesting take-aways from this initial pass at Solr performance benchmarking. First, these results are based on stock Solr 4.8.1 with no “tuning” of indexing performance configuration settings. I am using Shawn Heisey’s suggested GC settings (see: http://wiki.apache.org/solr/ShawnHeisey) on Java 1.7.0 u55. The only configuration change I made was to set the autoCommit settings to do a hard commit every 100,000 docs and a soft-commit every 60 seconds.
Second, sharding obviously helps with performance (as expected), but replication is expensive. For instance, indexing into a 20×1 collection (2 Solr cores per node on 10 nodes), resulted in 101,404 docs per second but a 10×2 collection (also has 2 cores per node), only gets 34,881 docs per second. That’s a huge difference in results where each node is basically hosting the same number of docs and doing about the same amount of work. The reason replication is slower is that even though the number of cores is the same, each leader must block until it receives a response when forwarding update requests to replicas. Oversharding helps because the client indexing app
lications (Hadoop reducer tasks in this case) send updates to each shard leader directly. Using the two strategies together (20×2), I get 40,536 docs per second.
The third lesson here is that Solr may accept updates too quickly, which can lead to bad query performance or worse (shard failure). So you’ll need to throttle back indexing throughput to a sustainable level as there is no request throttling support built into Solr. For me, this meant using fewer reducers such as 34 instead of 48, when using replication. My goal here was to avoid the peak CPU from being over 85% and only about 50-60% on average, leaving plenty of free cycles for query execution.
Obviously, no performance benchmark can be trusted unless it can be repeated by others. The good news here is that anyone can perform these same tests using Lucidworks’ open source Solr Scale Toolkit and Lucidworks’ Hadoop framework. Operating the Elastic MapReduce and SolrCloud clusters will cost roughly $17 per hour (10 Solr nodes x $0.70 + 20 m1.xlarge EMR core nodes * $0.48 + 1 m1.large EMR master x $0.24).
Wrap-up
I’ve covered many of the key features of the toolkit as it exists today. There are many other features I didn’t cover in the interest of time (mine and yours). So I encourage you to explore the toolkit further.
You should also have a good idea of the types of indexing workloads Solr can support, but your mileage will vary depending on document sizes, the complexity of your text analysis, network speed, and computing resources. I plan to perform addition performance benchmarks for Solr as time allows, where I focus on testing indexing performance while also running queries against the index.
Lastly, this framework is being actively developed, so please keep a look out for new features, bug fixes, and enhancements over the coming weeks. As with any new open source project, there are likely to be a few warts, bad assumptions, and design mistakes. Please kick the tires and provide feedback so that we can improve this solution for the Solr community. Happy scaling!
LEARN MORE
Contact us today to learn how Lucidworks can help your team create powerful search and discovery applications for your customers and employees.