Data Analytics Using Fusion and Logstash
Use Lucidworks Fusion and Logstash Logstash to analyze Fusion's logfiles.
Lucidworks Fusion now ships with plugins for Logstash. In my previous post on Log Analytics with Fusion, I showed how Fusion Dashboards provide interactive visualization over time-series data, using a small CSV file of cleansed server-log data. Today, I use Logstash to analyze Fusion’s logfiles – real live messy data!
Logstash is an open-source log management tool. Logstash takes inputs from one or more logfiles, parses and filters them according to a set of configurations, and outputs a stream of JSON objects where each object corresponds to a log event. Fusion 1.4 ships with a Logstash deployment plus a custom ruby class lucidworks_pipeline_output.rb which collects Logstash outputs and sends them to Solr for indexing into a Fusion collection.
Logstash filters can be used to normalize time and date formats, providing a unified view of a sequence of user actions which span multiple logfiles. For example, in an ecommerce application, where user search queries are recorded by the search server using one format and user browsing actions are recorded by the web server in a different format, Logstash provides a way of normalizing and unifying this information into a clearer picture of user behavior. Date and timestamp formats are some of the major pain points of text processing. Fusion provides custom date formatting, because your dates are a key part of your data. For log analytics, when visualizations include a timeline, timestamps are the key data.
In order to map Logstash records into Solr fielded documents you need to have a working Logstash configuration script that runs over your logfiles. If you’re new to Logstash, don’t panic! I’ll show you how to write a Logstash configuration script and then use it to index Fusion’s own logfiles. All you need is a running instance of Fusion 1.4 and you can try this at home, so if you haven’t done so already, download and install Fusion. Detailed instructions are in the online Fusion documentation: Installing Lucidworks Fusion.
Fusion Components and their Logfiles
What do Fusion’s log files look like? Fusion integrates many open-source and proprietary tools into a fault-tolerant, flexible, and highly scalable search and indexing system. A Fusion deployment consists of the following components:
- Solr – the Apache open-source Solr/Lucene search engine.
- API – this service transforms documents, queries, and search results. It communicates directly with Solr to carry out the actual document search and indexing.
- Connectors – the Connector service fetches and ingests raw data from external repositories.
- UI – the Fusion UI service handles user authentication, so all calls to both the browser-based GUI and the Fusion REST-API go to the Fusion UI. The browser-based GUI controls translate a user action into the correct sequence of calls to the API and Connectors services, and monitor and provide feedback on the results. REST-API calls are handed off to the back-end services after authentication.
Each of these components runs as a process in its own JVM. This allows for distributing and replicating services across servers for performance and scalability. On startup, Fusion reports on its components and the ports that they are listening on. For a local single-server installation with the default configuration, the output is similar to this:
2015-04-10 12:26:44Z Starting Fusion Solr on port 8983
2015-04-10 12:27:14Z Starting Fusion API Services on port 8765
2015-04-10 12:27:19Z Starting Fusion UI on port 8764
2015-04-10 12:27:25Z Starting Fusion Connectors on port 8984
All Fusion services use the Apache log4j logging utility. For the default Fusion deployment, the log4j directives are found in files: $FUSION/jetty/{service}/resources/log4j2.xml and logging outputs are written to files: $FUSION/logs/{service}/{service}.log, where service is either “api”, “connectors”, “solr”, or “ui” and $FUSION is shorthand for the full path to the top-level directory of the Fusion archive, e.g., if you’ve unpacked the Fusion download in /opt/lucidworks, $FUSION refers to directory /opt/lucidworks/fusion, a.k.a. the Fusion home directory. The default deployment for each of these components has most logfile message levels set at “$INFO”, resulting in lots of logfile messages. On startup, Fusion send a couple hundred messages to these logfiles. By the time you’ve configured your collection, datasource, and pipeline, you’ll have plenty of data to work with!
Data Design: Logfile Patterns
First I need to do some preliminary data analysis and data design. What logfile data do I want to extract and analyze?
All the log4j2.xml configuration files for the Fusion services use the same Log4j pattern layout:
<PatternLayout>
  <pattern>%d{ISO8601} - %-5p [%t:%C{1}@%L] - %m%n</pattern>
</PatternLayout>
In the Log4j syntax, the percent sign is followed by a conversion specifier (think c-style printf). In this pattern, the conversion specifiers used are:
- %d{ISO8601} : date format, with date specifier ISO8601
- %-5p : %p is the Priority of the logging event, “-5” specifies left-justified, with of 5 characters
- %t: thread
- %C{1}: %C specifies the fully qualified class name of the caller issuing the logging request, {1} specifies the number of rightmost components of the class name.
- %L: line number of where this request was issued
- %m: the application supplied message.
Here’s what what the resulting log file messages looks like:
2015-05-21T11:30:59,979 - INFO  [scheduled-task-pool-2:MetricSchedulesRegistrar@70] - Metrics indexing will be enabled
2015-05-21T11:31:00,198 - INFO  [qtp1990213994-17:SearchClusterComponent$SolrServerLoader@368] - Solr version 4.10.4, using JavaBin protocol
2015-05-21T11:31:00,300 - INFO  [solr-flush-0:SolrZkClient@210] - Using default ZkCredentialsProvider
To start with, I want to capture the timestamp, the priority of the logging event, and the application supplied message. The timestamp should be stored in a Solr TrieDateField, the event priority is a set of strings used for faceting, and the application supplied message should be stored as searchable text. Thus, in my Solr index, I want fields:
- log4j_timestamp_tdt
- log4j_level_s
- log4j_message_t
Note that these field names all have suffixes which encode the field type: the suffix “_tdt” is used for Solr TrieDateFields, the suffix “_s” is used for Solr string fields, and the suffix “_t” is used for Solr text fields.
A grok filter is applied to input line(s) from a logfile and outputs a Logstash event which is a list of field-value pairs produced by matches against a grok pattern. A grok pattern is specified as: %{SYNTAX:SEMANTIC}, where SYNTAX is the pattern to match against, SEMANTIC is the field name in the Logstash event. The Logstash grok filter used for this example is:
%{TIMESTAMP_ISO8601:log4j_timestamp_tdt} *-* %{LOGLEVEL:log4j_level_s}s+*[*S+*]* *-* %{GREEDYDATA:log4j_msgs_t}
This filter uses three grok patterns to match the log4j layout:
- The Logstash pattern
TIMESTAMP_ISO8601matches the log4j timestamp pattern%d{ISO8601}. - The Logstash pattern
LOGLEVELmatches the Priority pattern%p. - The
GREEDYDATApattern can be used to match everything left on the line.
I used the Grok Constructor tool to develop and test my log4j grok filter. I highly recommend this tool and associated website to all Logstash noobs – I learned alot!
To skip over the [thread:class@line] - information, I’m using the regex "*[*S+*]* *-*". Here the asterisks act like single quotes to escape characters which otherwise would be syntactically meaningful. This regex fails to match class names which contain whitespace, but it fails conservatively, so the final greedy pattern will still capture the entire application output message.
To apply this filter to my Fusion logfiles, the complete Logstash script is:
input {
    file {
        path => '/Users/mitzimorris/fusion/logs/ui/ui.log'
        start_position => 'beginning'
        codec => multiline {
            pattern => "^%{TIMESTAMP_ISO8601} "
            negate => true
            what => previous
        }
    }
    file {
        path => '/Users/mitzimorris/fusion/logs/api/api.log'
        start_position => 'beginning'
        codec => multiline {
            pattern => "^%{TIMESTAMP_ISO8601} "
            negate => true
            what => previous
        }
    }
    file {
        path => '/Users/mitzimorris/fusion/logs/connectors/connectors.log'
        start_position => 'beginning'
        codec => multiline {
            pattern => "^%{TIMESTAMP_ISO8601} "
            negate => true
            what => previous
        }
    }
}
filter {
    grok {
        match => { 'message' => '%{TIMESTAMP_ISO8601:log4j_timestamp_tdt} *-* %{LOGLEVEL:log4j_level_s}s+*[*S+*]* *-* %{GREEDYDATA:log4j_msgs_t}' }
    }
}
output {
}
This script specifies the set of logfiles to monitor. Since logfile messages may span multiple lines, for each logfile I use a Logstash codec, for multiline files, following the Logstash docs example. This codec is the same for all files but must be applied to each input file in order to avoid interleaving lines from different logfiles. The actual work is done in the filter clause, by the grok filter discussed above.
Indexing Logfiles with Fusion and Logstash
Using Fusion to index the Fusion logfiles requires the following:
- A Fusion Collection to hold the logfile data
- A Fusion Datasource that uses the Logstash configuration to process the logfiles
- A Fusion Index Pipeline which transforms Logstash records into a Solr document.
Fusion Collection: MyFusionLogfiles
A Fusion collection is a Solr collection plus a set of Fusion components. The Solr collection holds all of your data. The Fusion components include a pair of Fusion pipelines: one for indexing, one for search queries.
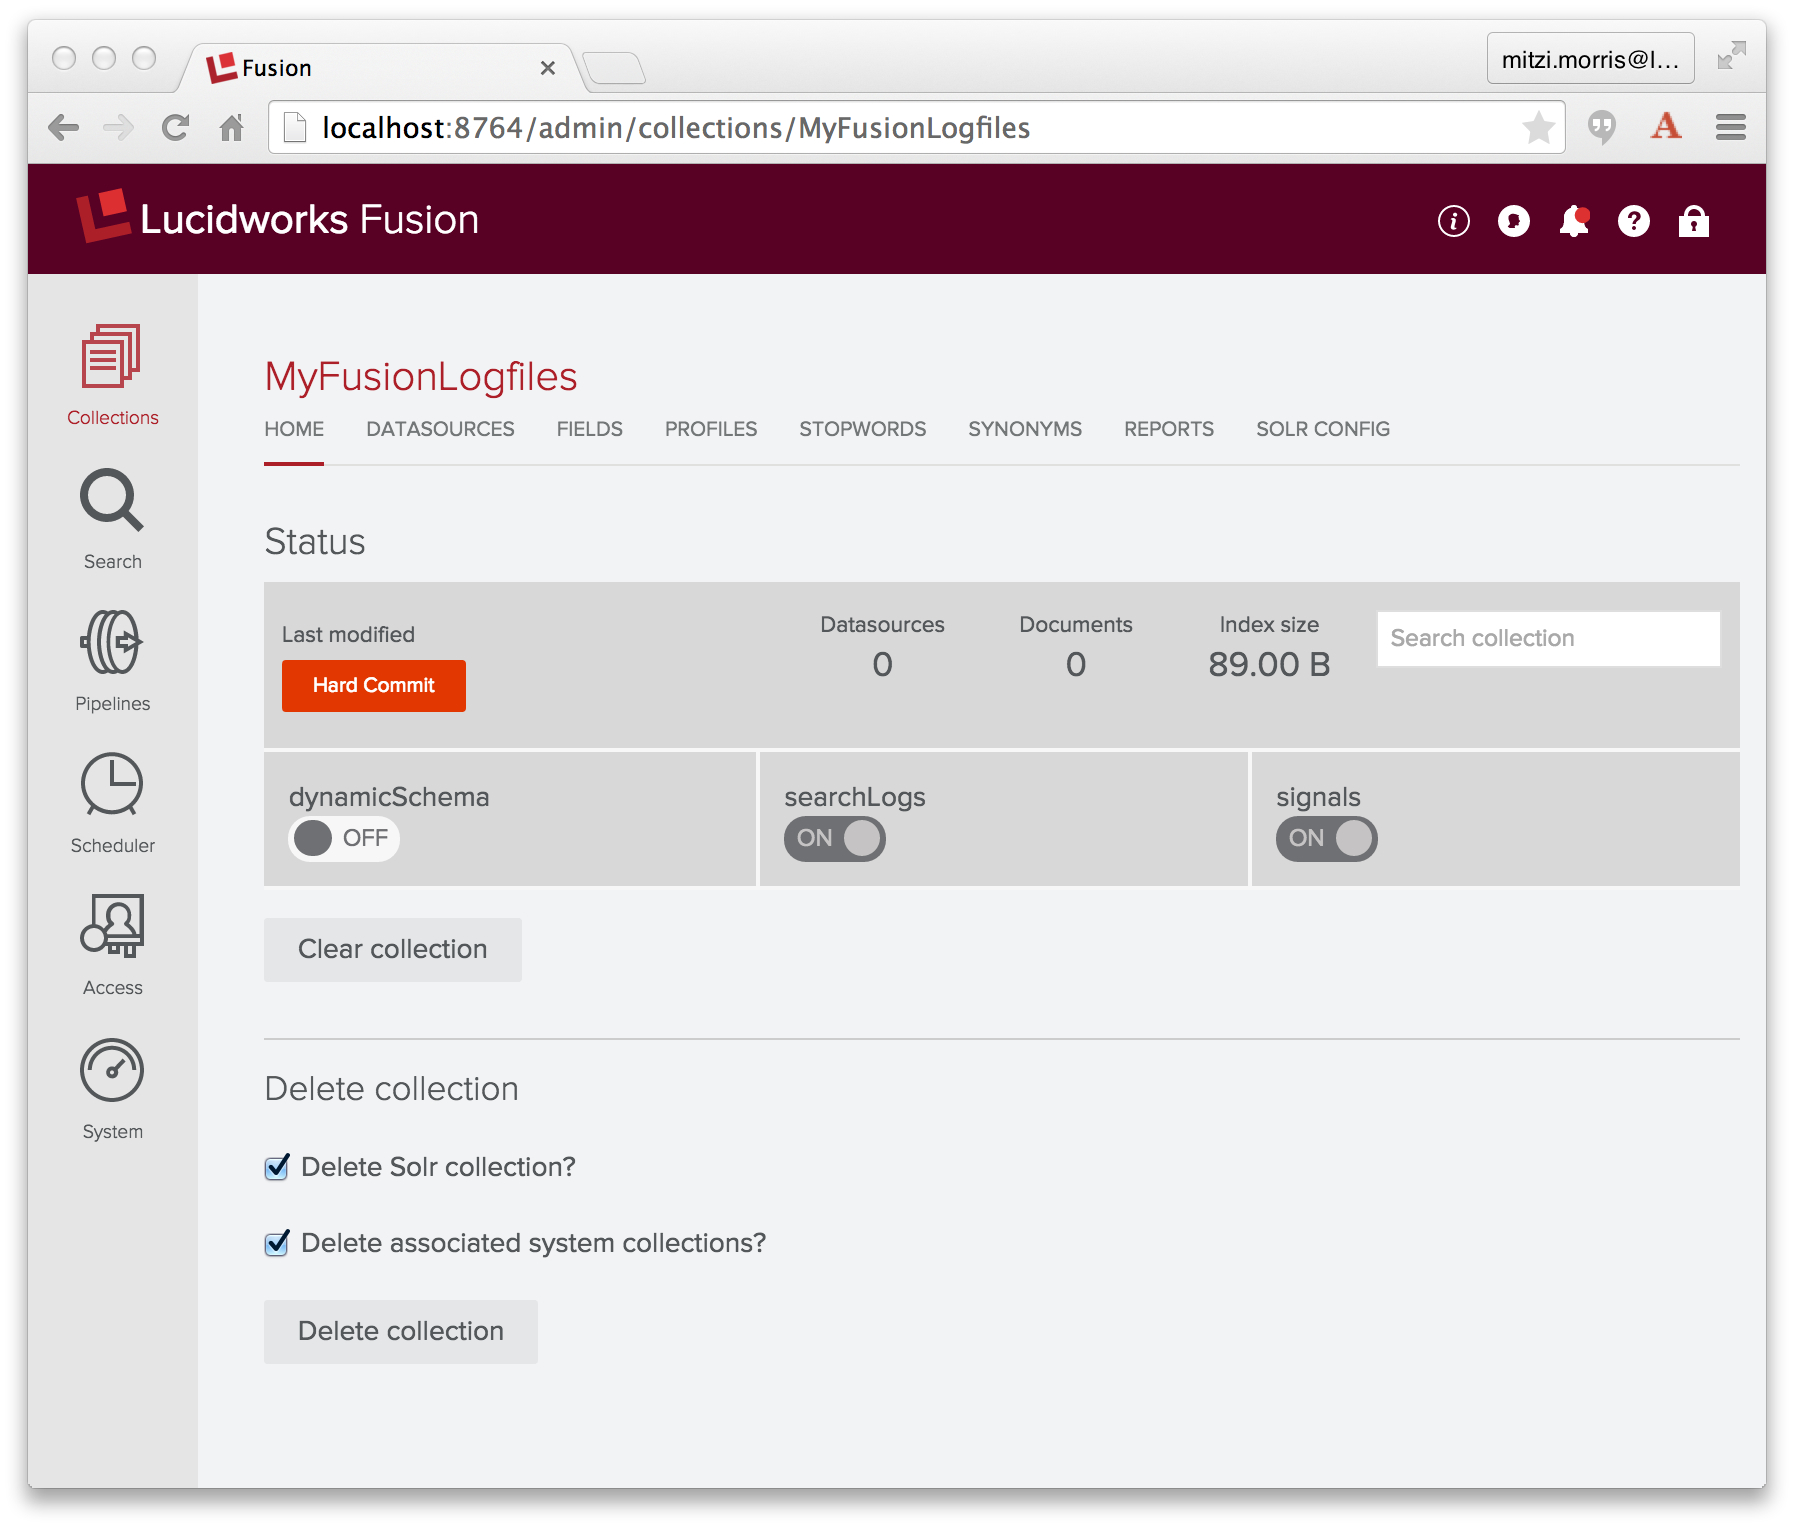
I create a collection named “MyFusionLogfiles” using the Fusion UI Admin Tool. Fusion creates an indexing pipeline called “MyFusionLogfiles-default”, as well as a query pipeline with the same name. Here is the initial collection:
Logstash Datasource: MyFusionLogfiles-datasource
Fusion calls Logstash using a Datasource configured to connect to Logstash.
Datasources store information about how to ingest data and they manage the ongoing flow of data into your application: the details of the data repository, how to access the repository, how to send raw data to a Fusion pipeline for Solr indexing, and the Fusion collection that contains the resulting Solr index. Fusion also records each time a datasource job is run and records the number of documents processed.
Datasources are managed by the Fusion UI Admin Tool or by direct calls to the REST-API. The Admin Tool provides a home page for each collection as well as datasources panel. For the collection named “MyFusionLogfiles” the URL of the collection home page is: http://<server>:<port>/admin/collections/MyFusionLogfiles and the URL of the datasources panel is http://<server>:<port>/admin/collections/MyFusionLogfiles/datasources.
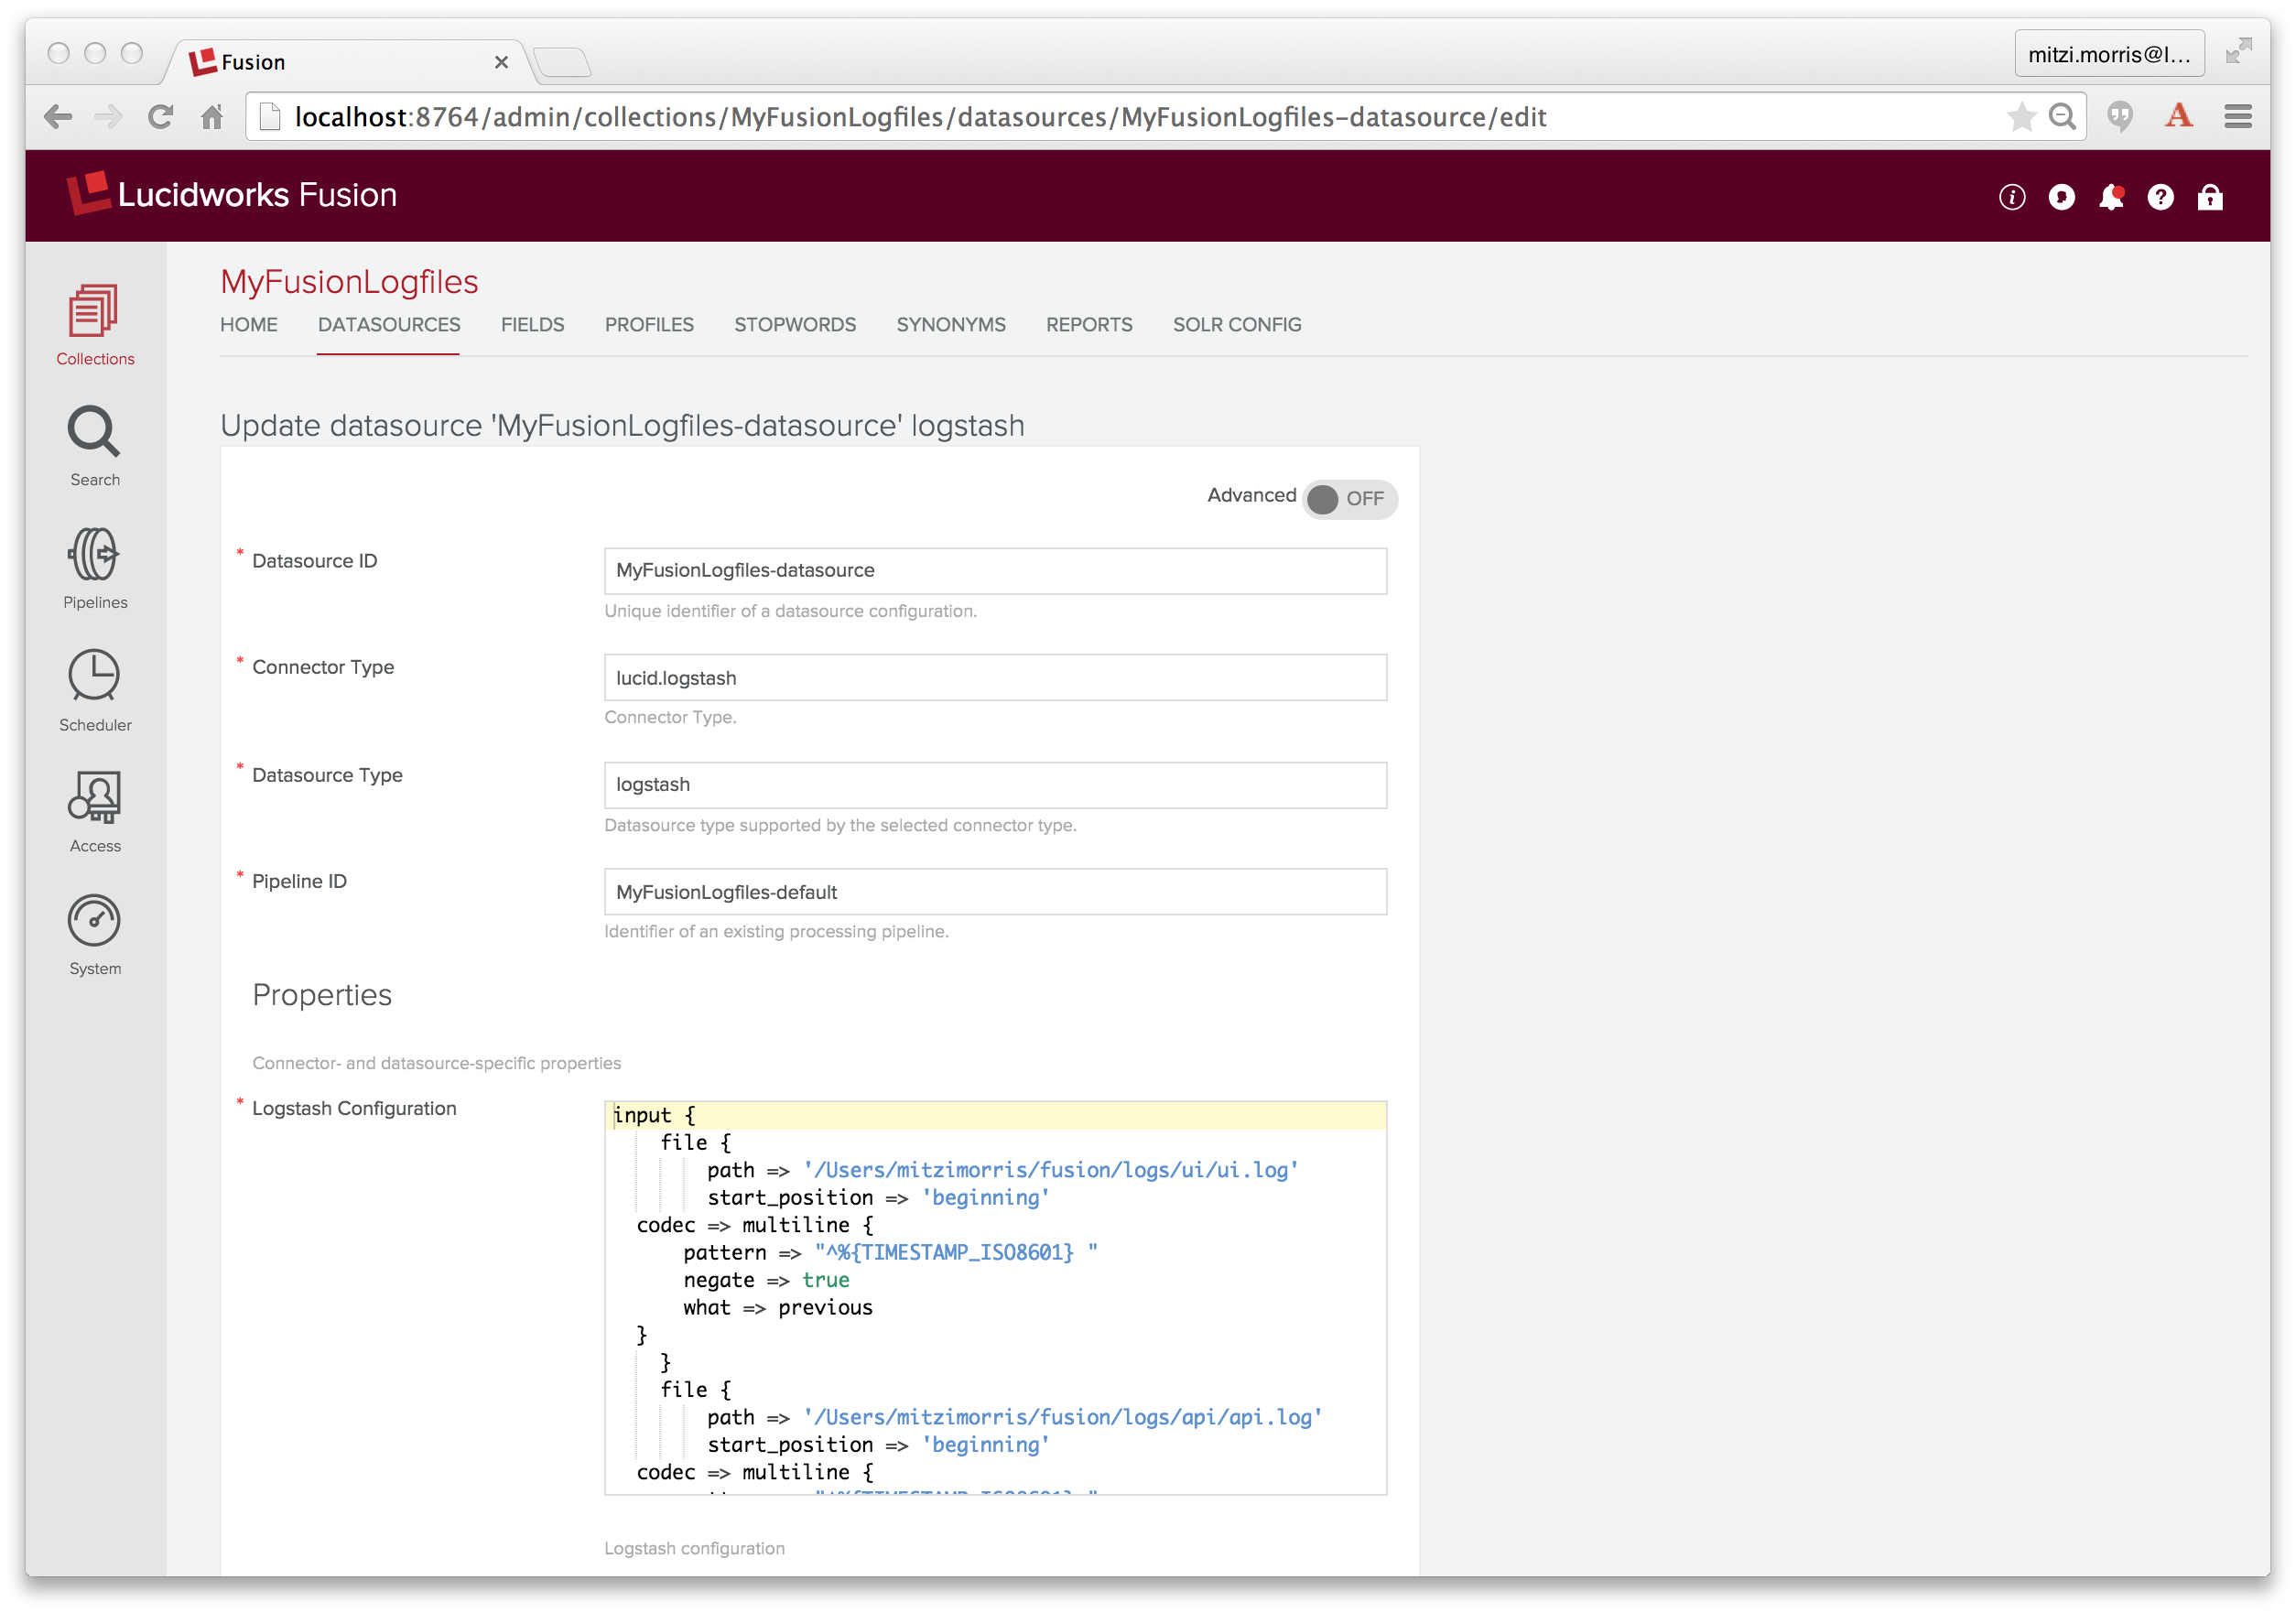
To create a Logstash datasource, I choose “Logging” datasource of type “Logstash”. In the configuration panel I name the datasource “MyFusionLogfiles-datasource”, specify “MyFusionLogfiles-default” as the index pipeline to use, and copy the Logstash script into the Logstash configuration input box (which is a JavaScript enabled text input box).
Index Pipeline: MyFusionLogfiles-default
An Index pipeline transforms Logstash records into fielded documents for indexing by Solr. Fusion pipelines are composed of a sequence of one or more stages, where the inputs to one stage are the outputs from the previous stage. Fusion stages operate on PipelineDocument objects which organize the data submitted to the pipeline into a list of named field-value pairs, (discussed in a previous blog post). All PipelineDocument field values are strings. The inputs to the initial index pipeline stage are the output from the connector. The final stage is a Solr Indexer stage which sends its output to Solr for indexing into a Fusion collection.
In configuring the above datasource, I specified index pipeline “MyFusionLogfiles-default”, the index pipeline created in tandem with collection “MyFusionLogfiles”, which, as initially created, consists of a Solr Indexer stage:
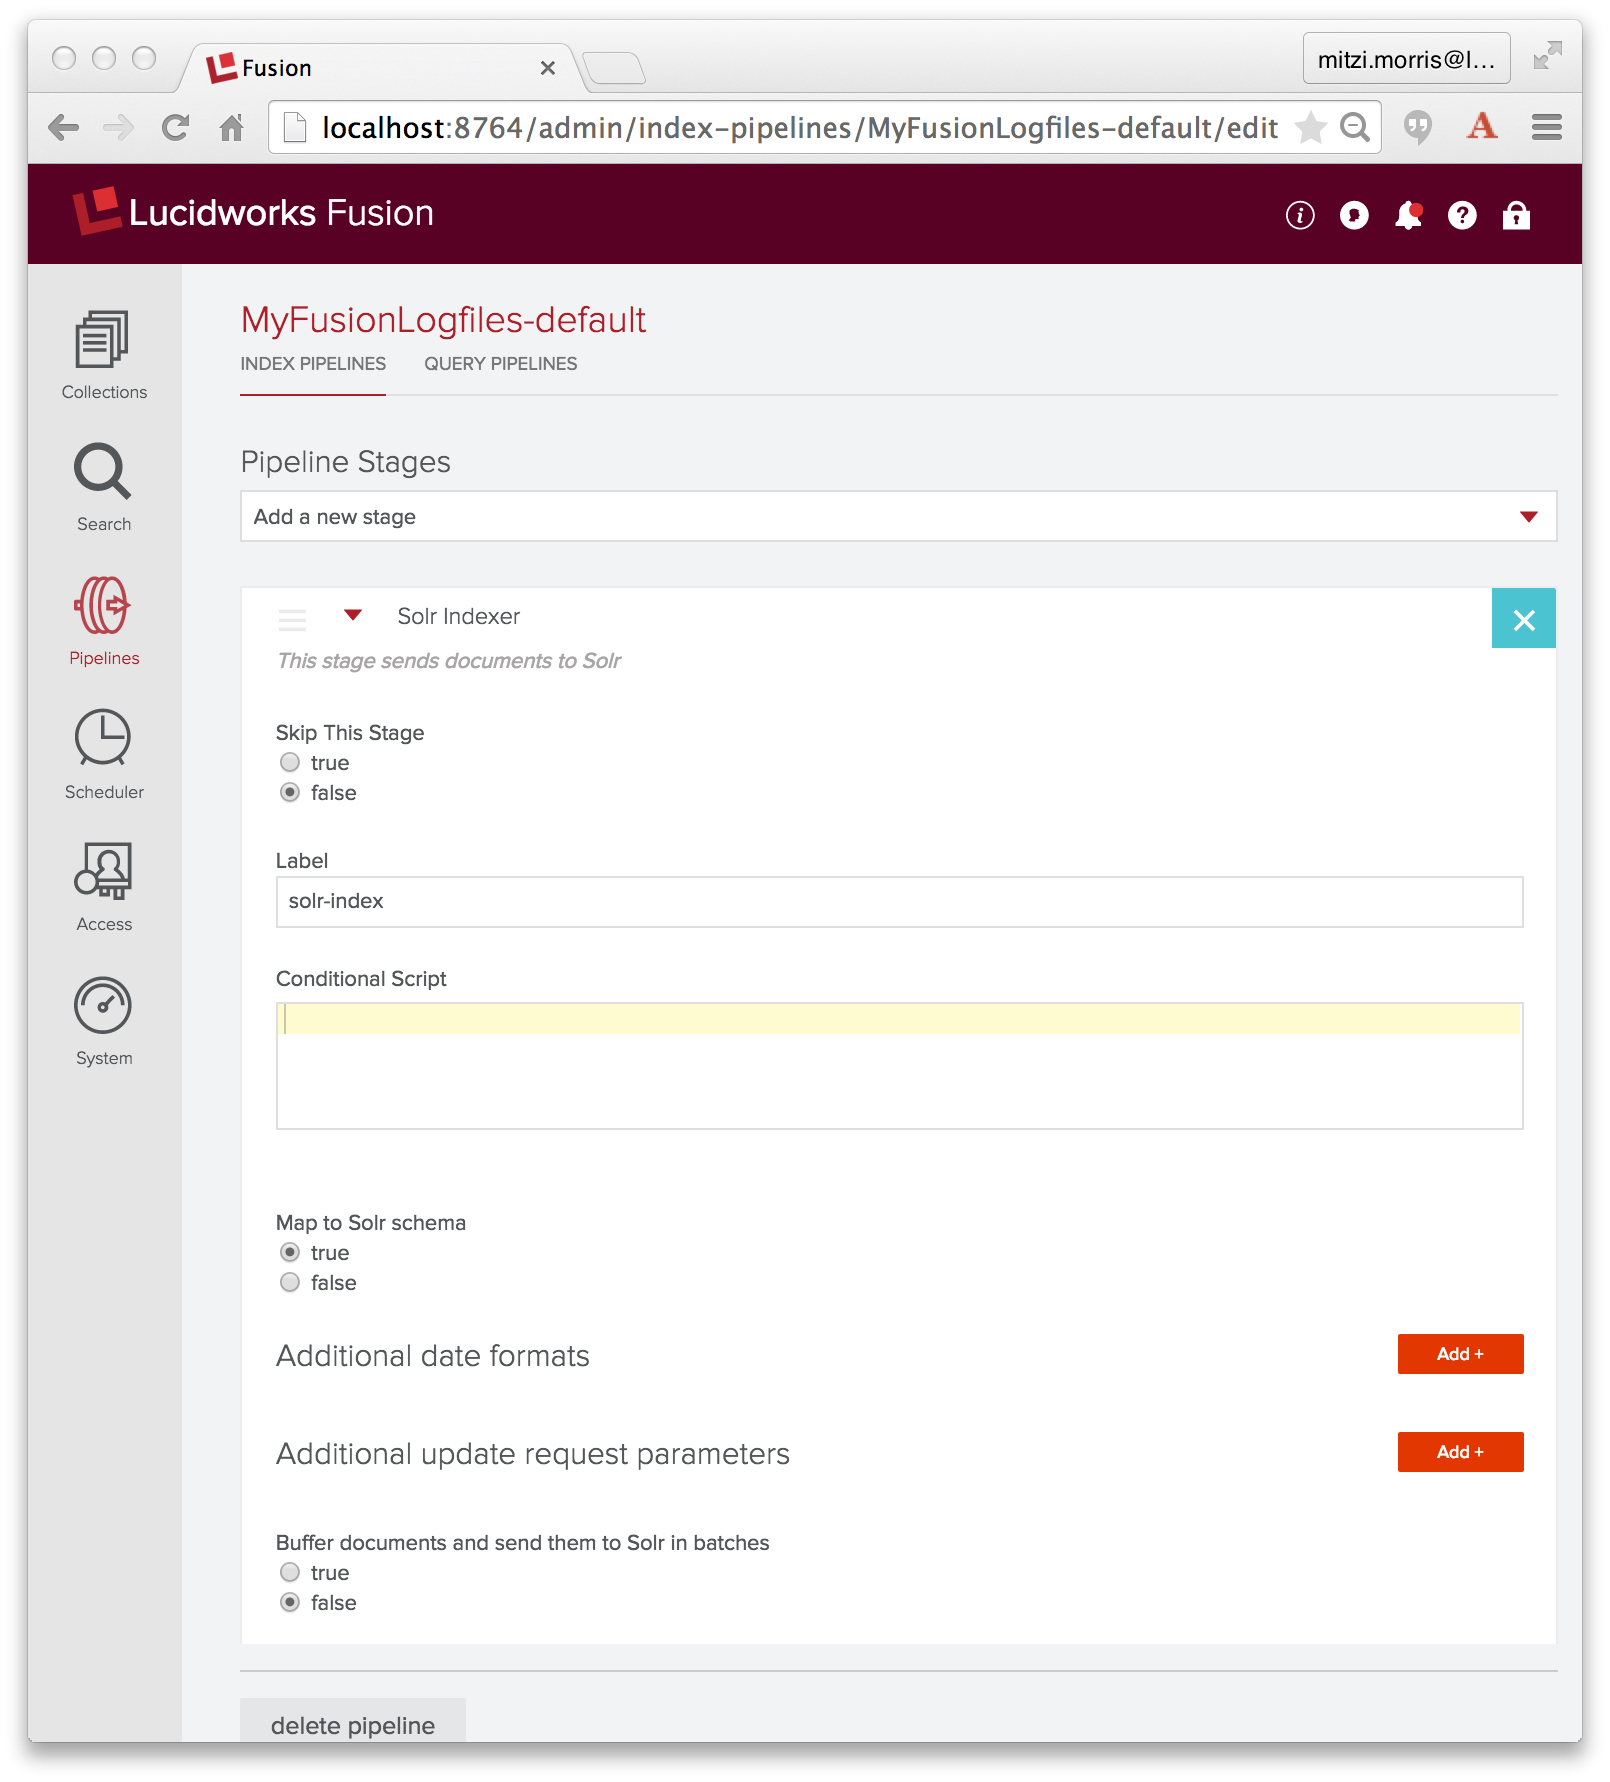
The job of the Solr Indexer stage is to transform the PipelineDocument into a Solr document. Solr provides a rich set of datatypes, including datetime and numeric types. By default, a Solr Indexer stage is configured with property “enforceSchema” set to true, so that for each field in the PipelineDocument, the Solr Indexer stage checks the field name to see whether it is a valid field name for the collection’s Solr schema and whether or not the field contents can be converted into a valid instance of the Solr field’s defined datatype. If the field name is unknown or the PipelineDocument field is recognized as a Solr numeric or datetime field, but the field value cannot be converted to the proper type, then the Solr indexer stage transforms the field name so that the field contents are added to the collection as a text data field. This means that all of your data will be indexed into Solr, but the Solr document might not have the set of fields that you expect, instead your data will be in a field with an automatically generated field name, indexed as text.
Note that above, I carefully specified the grok filter so that the field names encode the field types: field “log4j_timestamp_tdt” is a Solr TrieDateField, field “log4j_level_s” is a Solr string field, and field “log4j_message_t” is a Solr text field.
Spoiler alert: this won’t work. Stay tuned for the fail and the fix.
Running the Datasource
To ingest and index the Logstash data, I run the configured datasource using the controls displayed underneath the datasource name. Here is a screenshot of the “Datasources” panel of the the Fusion UI Admin Tool while the Logstash datasource “MyFusionLogfiles-datasource” is running:
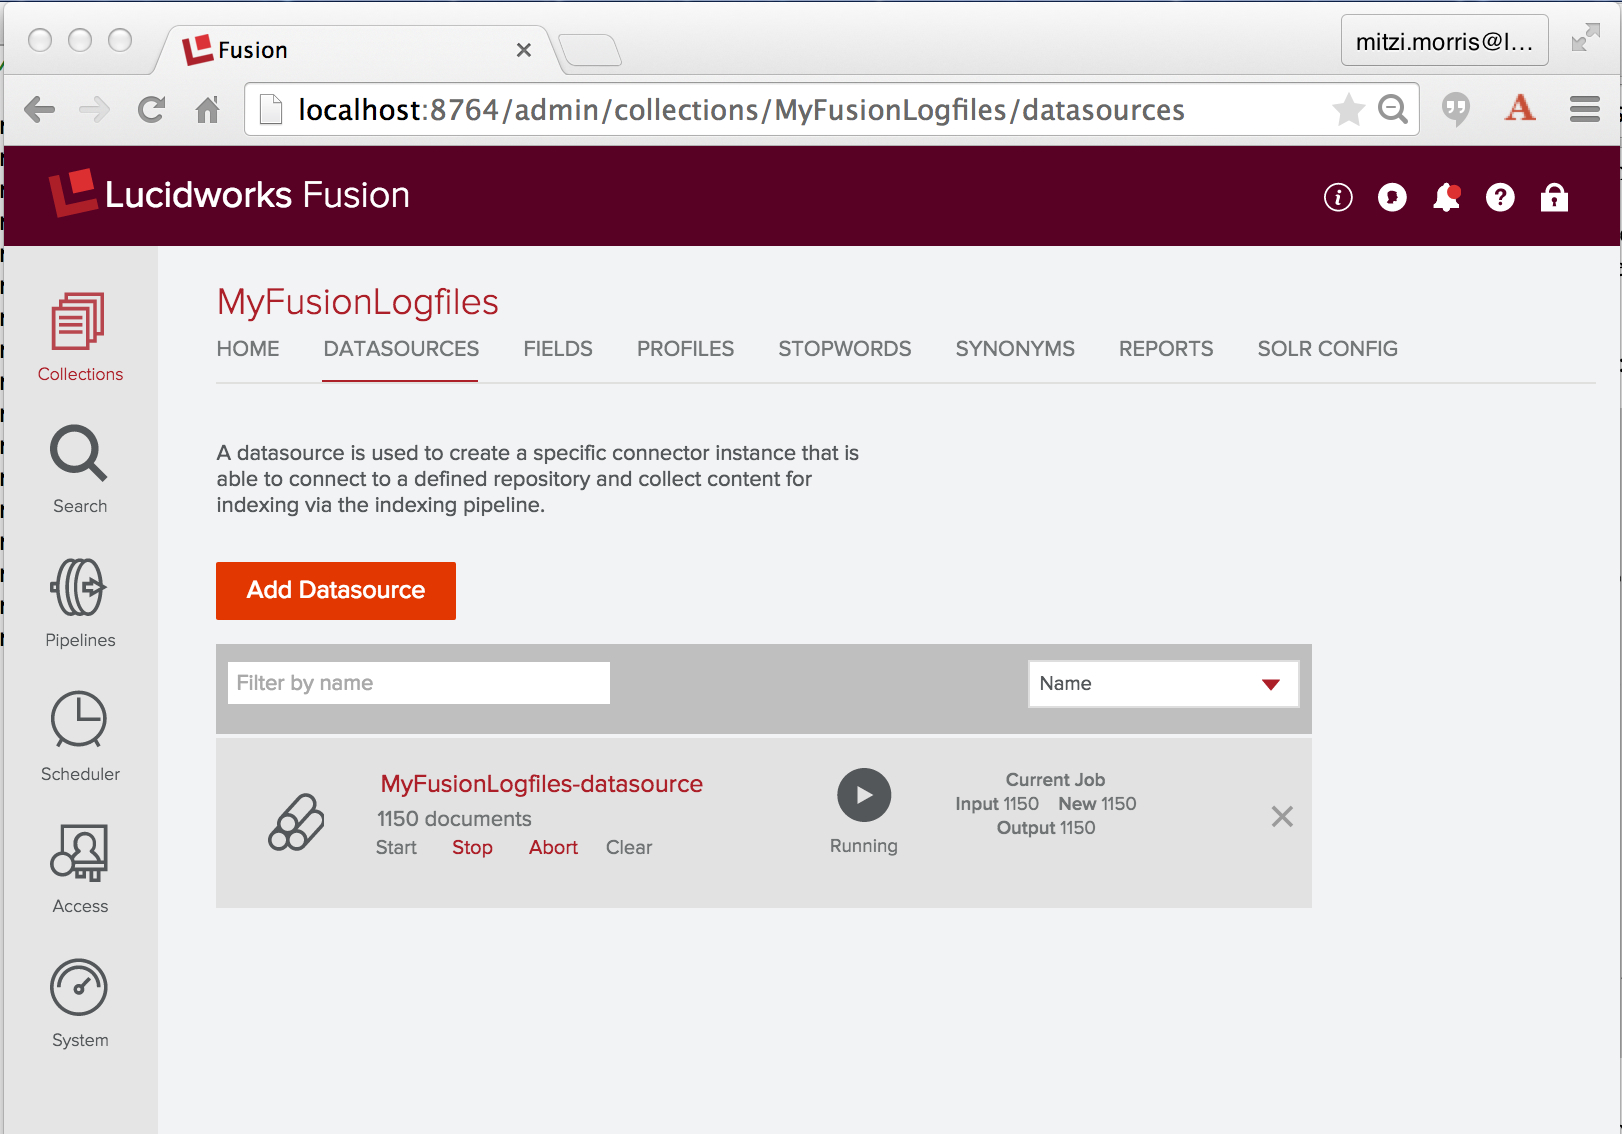
Once started, a Logstash connector will continue to run indefinitely. Since I’m using Fusion to index its own logfiles, including the connectors logfile, running this datasource will continue to generate new logfile entries to index. Before starting this job, I do a quick count on the number of logfile entries across the three logfiles I’m going to index:
> grep "^2015" api/api.log connectors/connectors.log ui/ui.log | wc -l
   1537
After a few minutes, I’ve indexed over 2000 documents, so I click on the “stop” control. Then I go back to the “home” panel and check my work by running a wildcard search (“*”) over the collection “MyFusionLogfiles”. The first result looks like this:
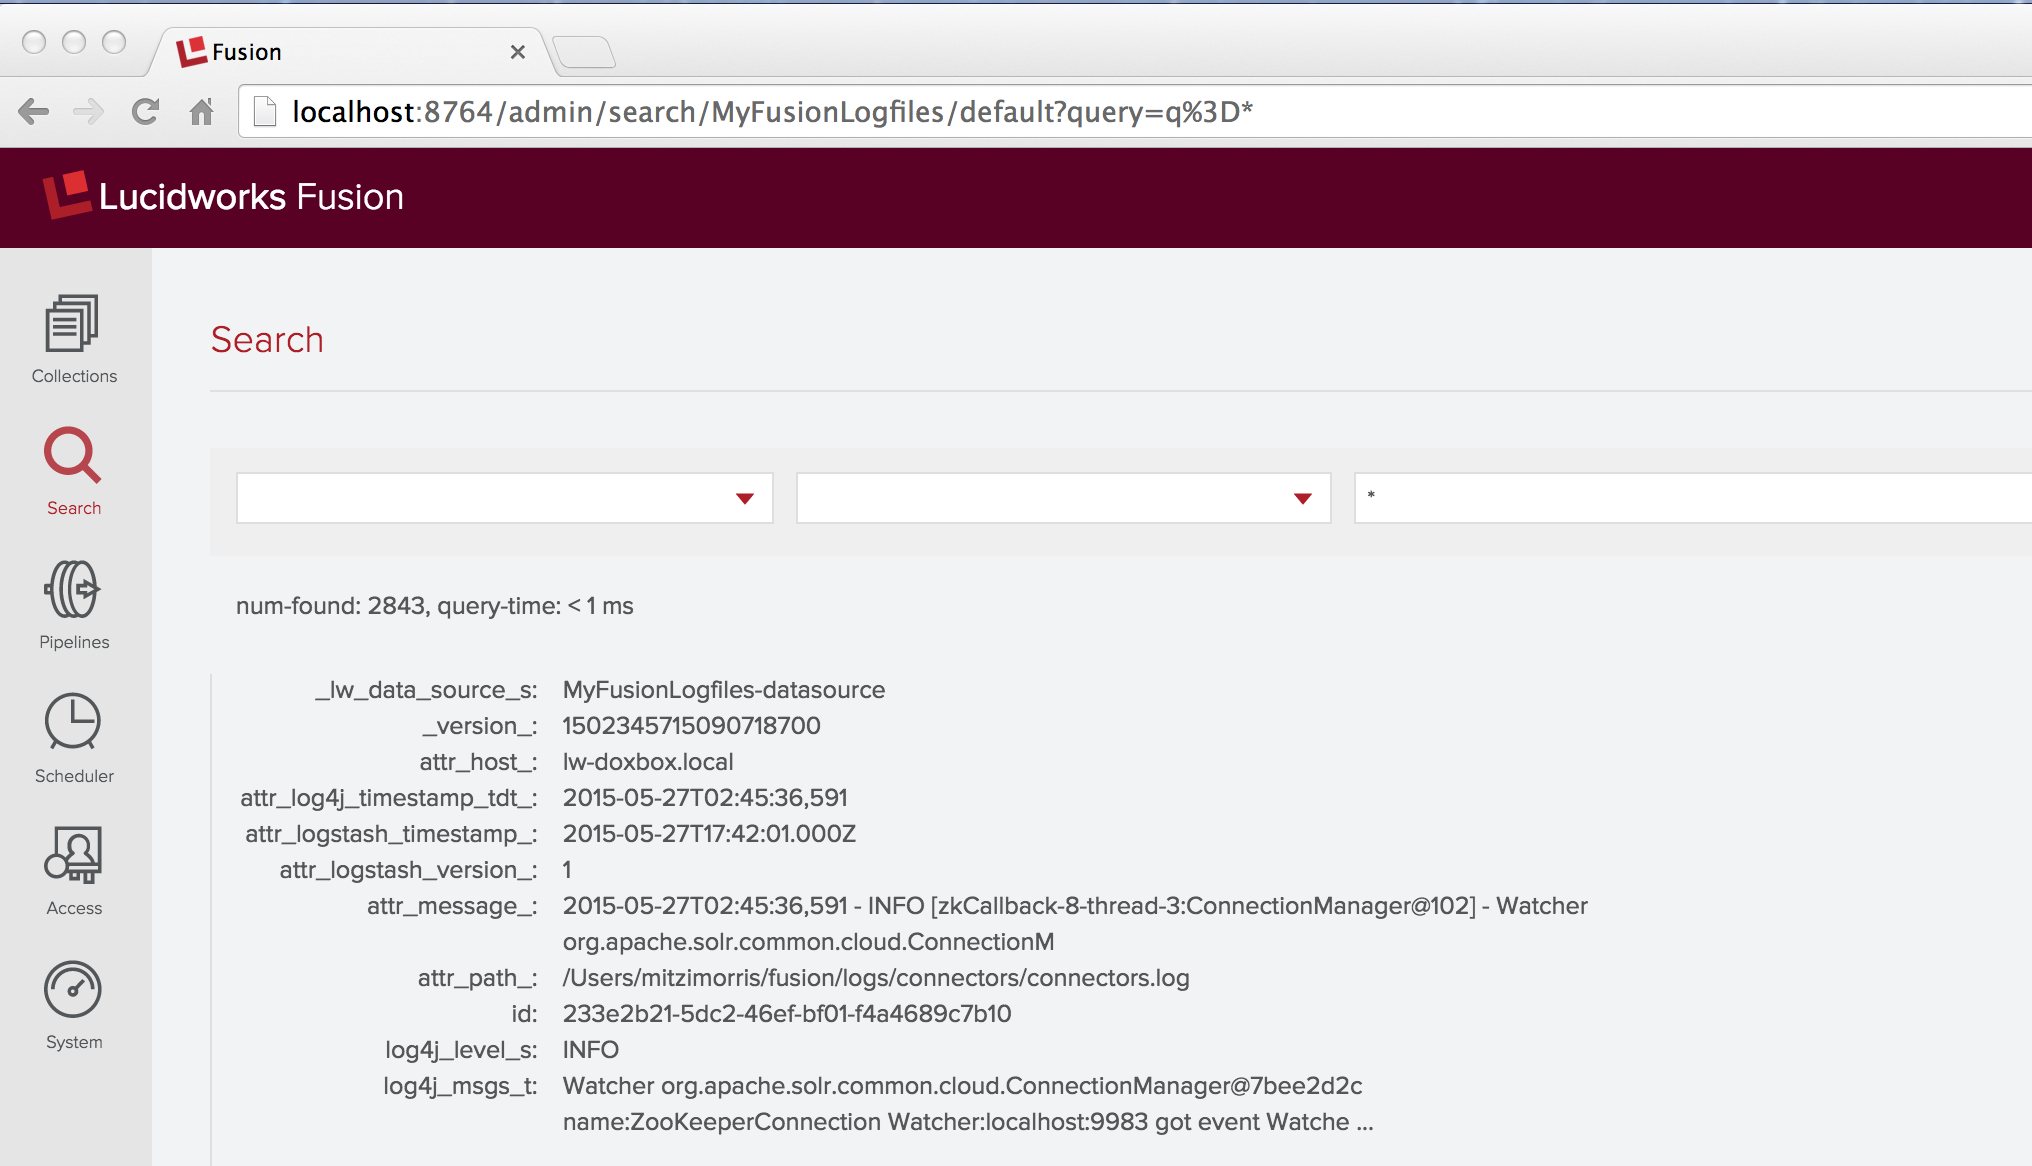
This result contains the fail that I promised. The raw logfile message was:
2015-05-27T02:45:36,591 - INFO [zkCallback-8-thread-3:ConnectionManager@102] - Watcher org.apache.solr.common.cloud.ConnectionManager@7bee2d2c name:ZooKeeperConnection Watcher:localhost:9983 got event WatchedEvent state:Disconnected type:None path:null path:null type:None
The document contains fields named “log4j_level_s” and “log4j_msgs_t”, but there’s no field named “log4j_timestamp_tdt” – instead there’s a field “attr_log4j_timestamp_tdt_” with value “2015-05-27T02:45:36,591”. This is the work of the Solr indexer stage, which renamed this field by adding the prefix “attr_” as well as a suffix “_”. The Solr schemas for Fusion collections have a dynamic field definition:
<dynamicField name="attr_*" type="text_general" indexed="true" stored="true" multiValued="true"/>
This explains the specifics of the resulting field name and field type, but it doesn’t explain why this remapping was necessary.
Fixing the Fail
Why isn’t the Log4j timestamp “2015-05-27T02:45:36,591” a valid timestamp for Solr? The answer is that the Solr date format is:
yyyy-MM-dd'T'HH:mm:ss.SSS'Z'
‘Z’ is the special Coordinated Universal Time (UTC) designator. Because Lucene/Solr range queries over timestamps require timestamps to be strictly comparable, all date information must be expressed in UTC. The Log4j timestamp presents two problems:
- the Log4j timestamp uses a comma separator between seconds and milliseconds
- the Log4j timestamp is missing the ‘Z’ and doesn’t include any timezone information.
The first problem is just a simple formatting problem. The second problem is non-trivial: the Log4j timestamps aren’t in UTC already, they’re expressed as the current local time of whatever machine the instrumented code is running on. Luckily I know the timezone, since this ran on my laptop, which is set to Timezone EDT (Eastern Daylight Time, UTC -0400).
Because date/time data is a key datatype, Fusion provides a Date Parsing index stage, which parses and normalizes date/time data in document fields. Therefore, to fix this problem, I add a Date Parsing stage to index pipeline “MyFusionLogfiles-default”, where I specify the source field as “log4j_timestamp_tdt”, the date format as “yyyy-MM-dd’T’HH:mm:ss,SSS”, and the timezone as “EDT”:
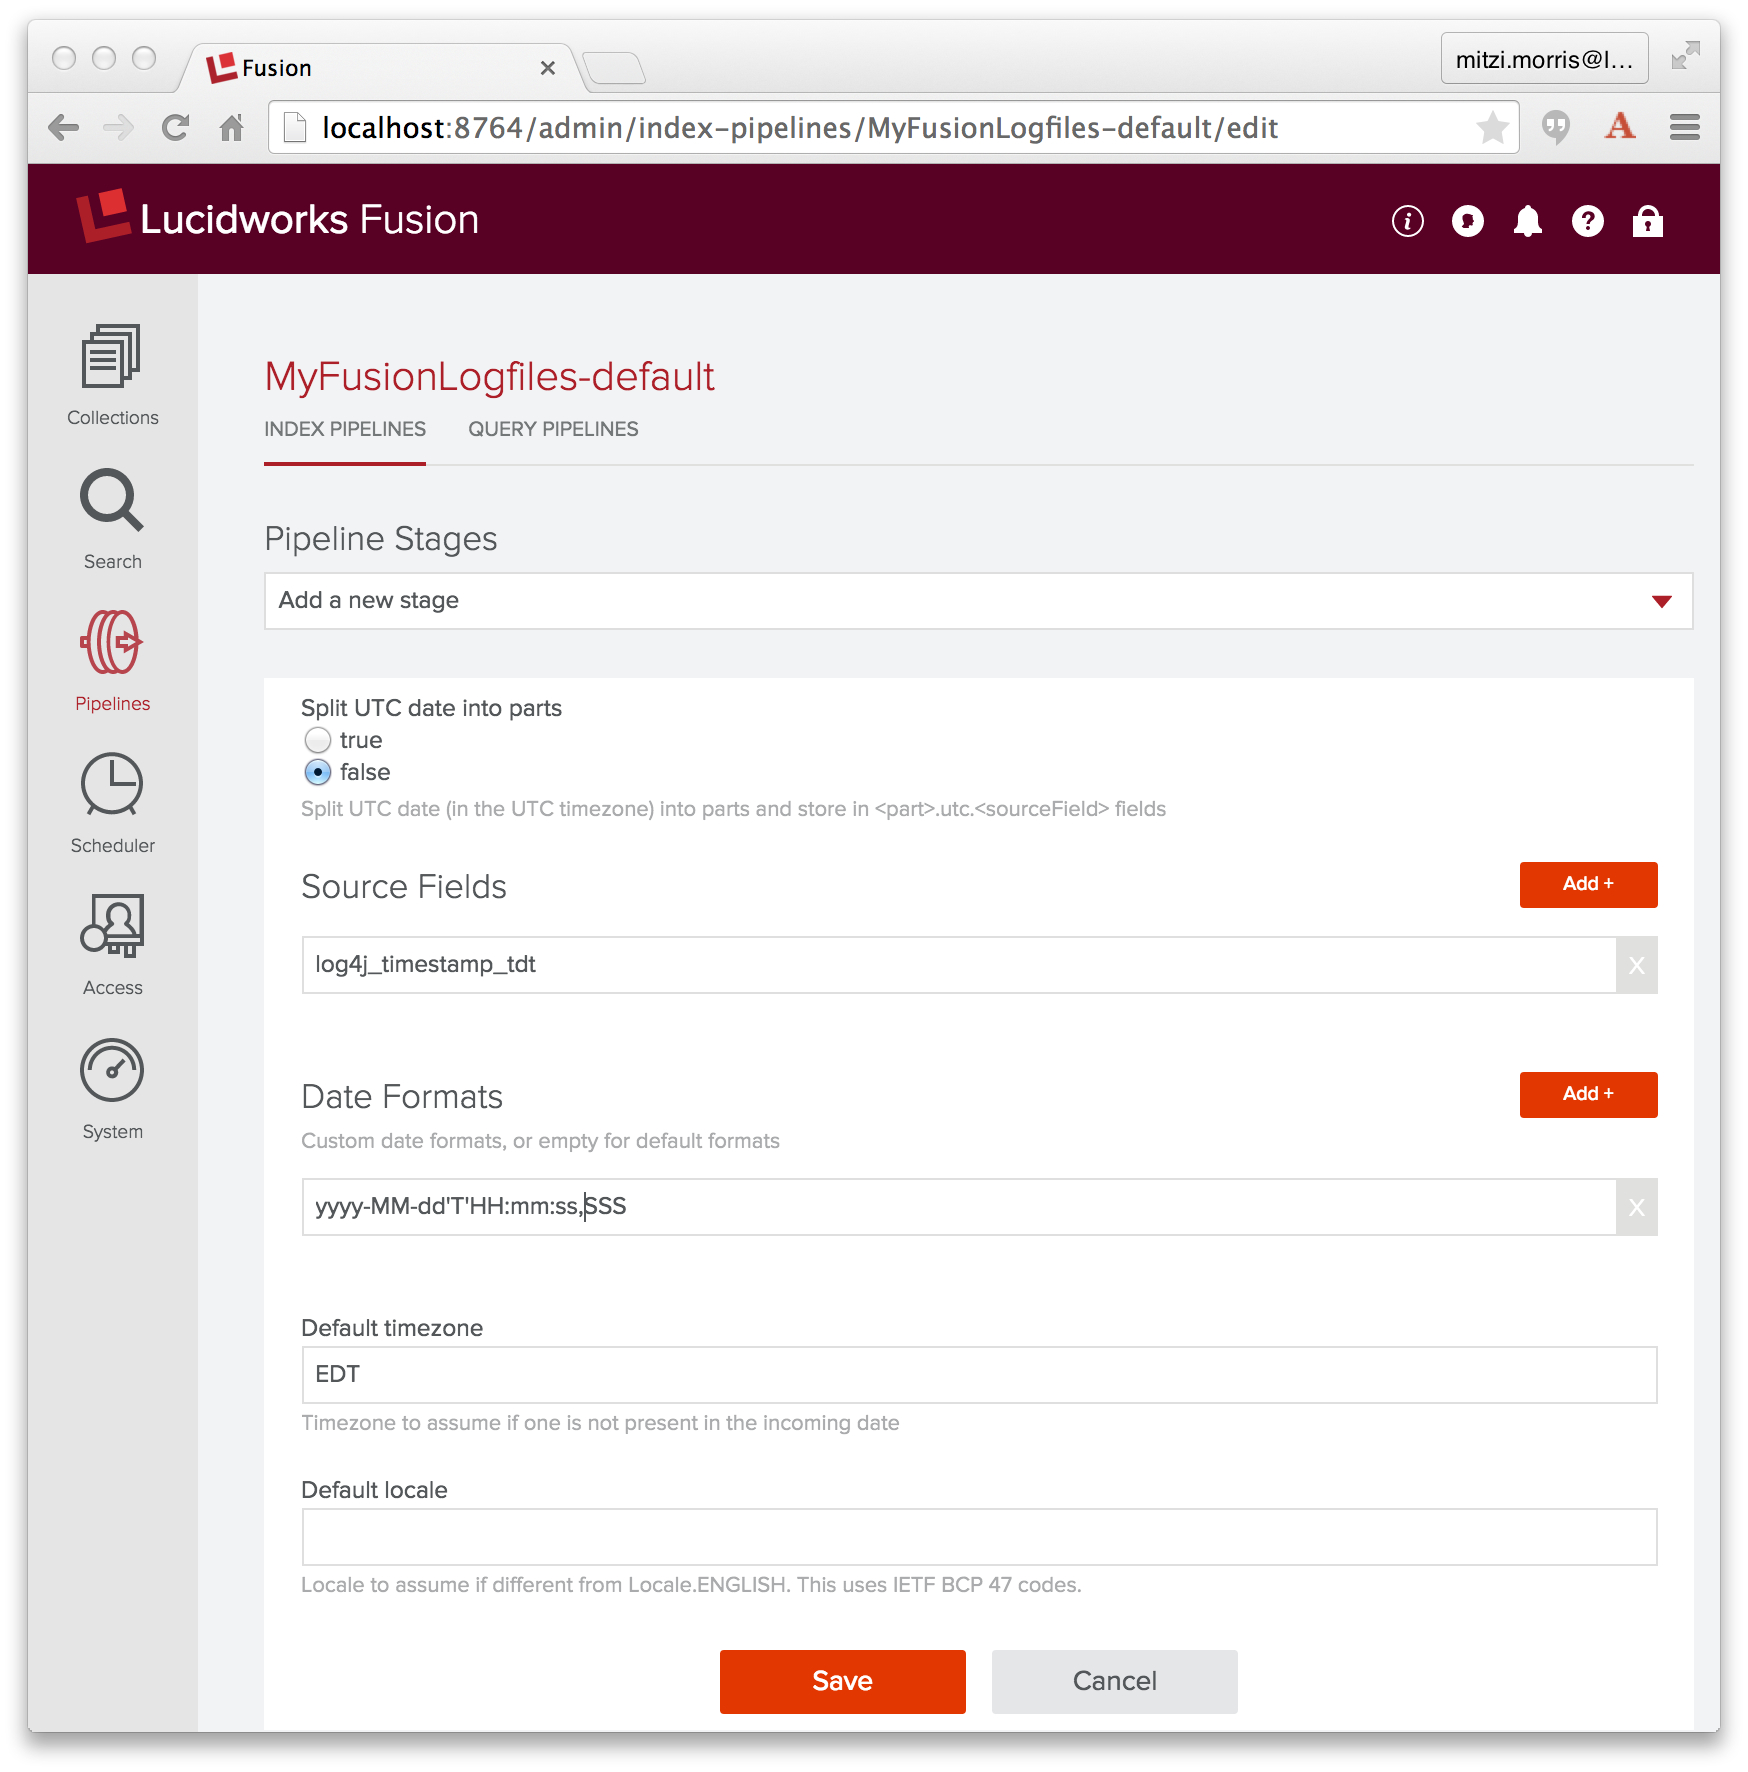
This stage must come before the Solr Indexer stage. In the Fusion UI, adding a new stage to a pipeline puts it at the end of the pipeline, so I need to reorder the pipeline by dragging the Date Parsing stage so that it precedes the Solr Indexer stage.
Once this change is in place, I clear both the collection and the datasource and re-run the indexing job. An annoying detail for the Logstash connector is that in order to clear the datasource, I need to track down the Logstash “since_db” files on disk, which track the last line read in each of the Logstash input files, (known issue, CONN-881). On my machine, I find a trio of hidden files in my home directory, with names that start with “.sincedb_” and followed by ids like “1e63ae1742505a80b50f4a122e1e0810”, and delete them.
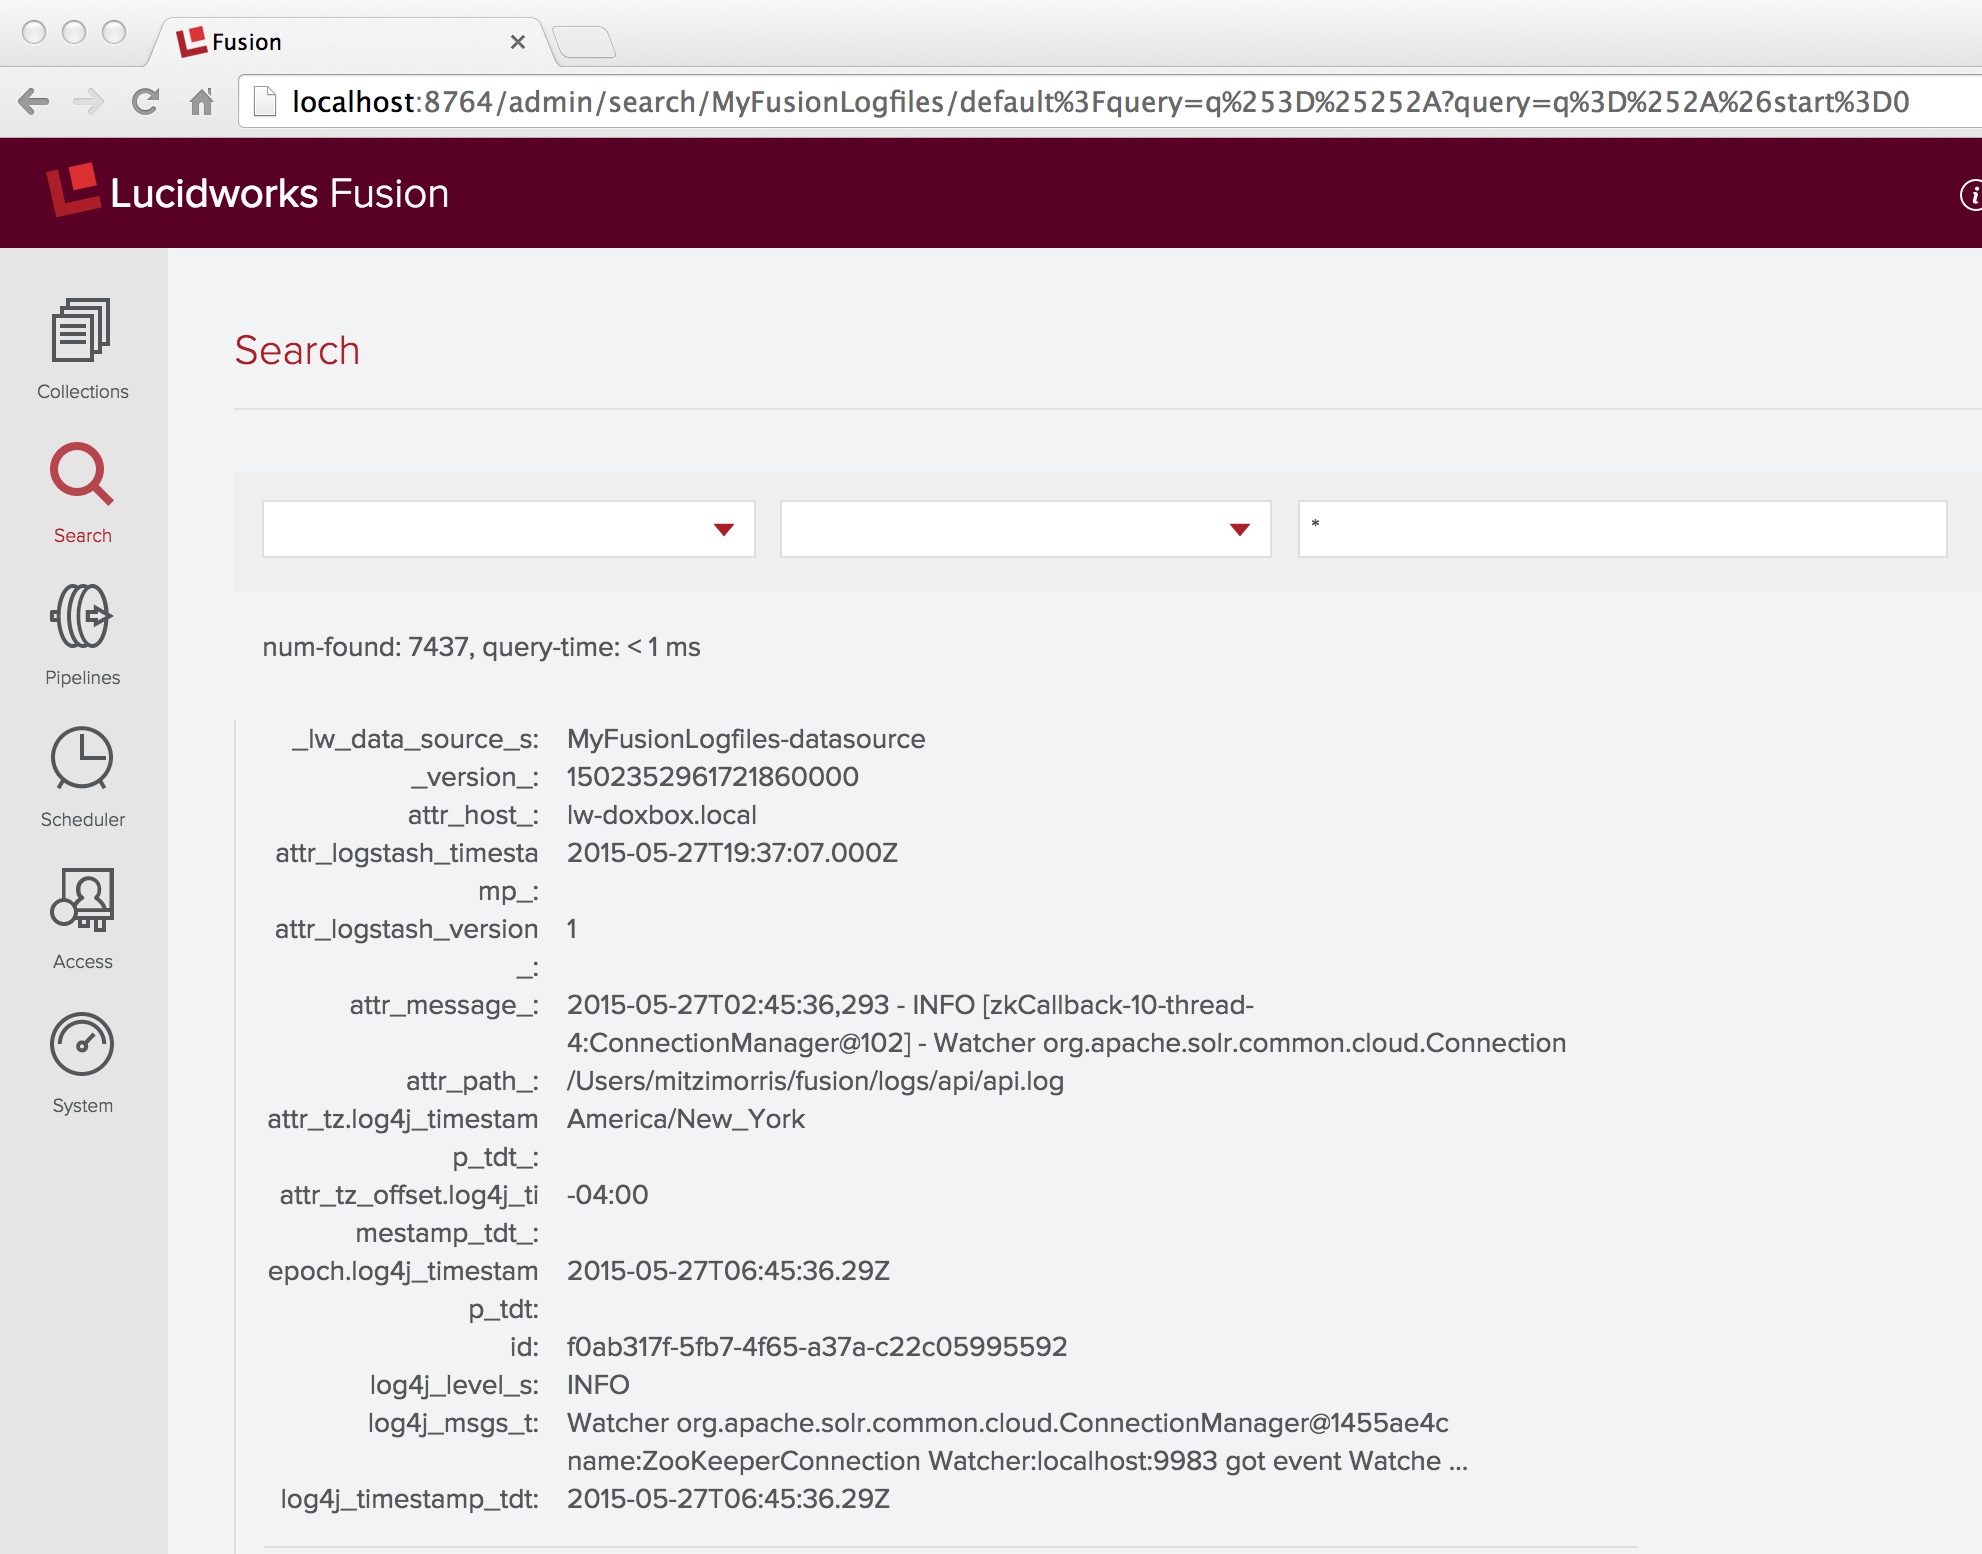
Problem solved! A wildcard search over all documents in collection “MyFusionLogfiles” shows that the set of document fields includes “log4j_timestamp_tdt” field, along with several fields added by the Date Parsing index stage:
Lessons Learned
More than 90% of data analytics is data munging, because the data never fits together quite as cleanly as it ought to.
Once you accept this fact, you will appreciate the power and flexibility of Fusion Pipeline index stages and the power and convenience of the tools on the Fusion UI.
Fusion Log Analytics with Fusion
Fusion Dashboards provide interactive visualizations over your data. This is a reprise of the information in my previous post on Log Analytics with Fusion, which used a small CSV file of cleansed server-log data. Now that I’ve got three logfile’s worth of data, I’ll create a similar dashboard.
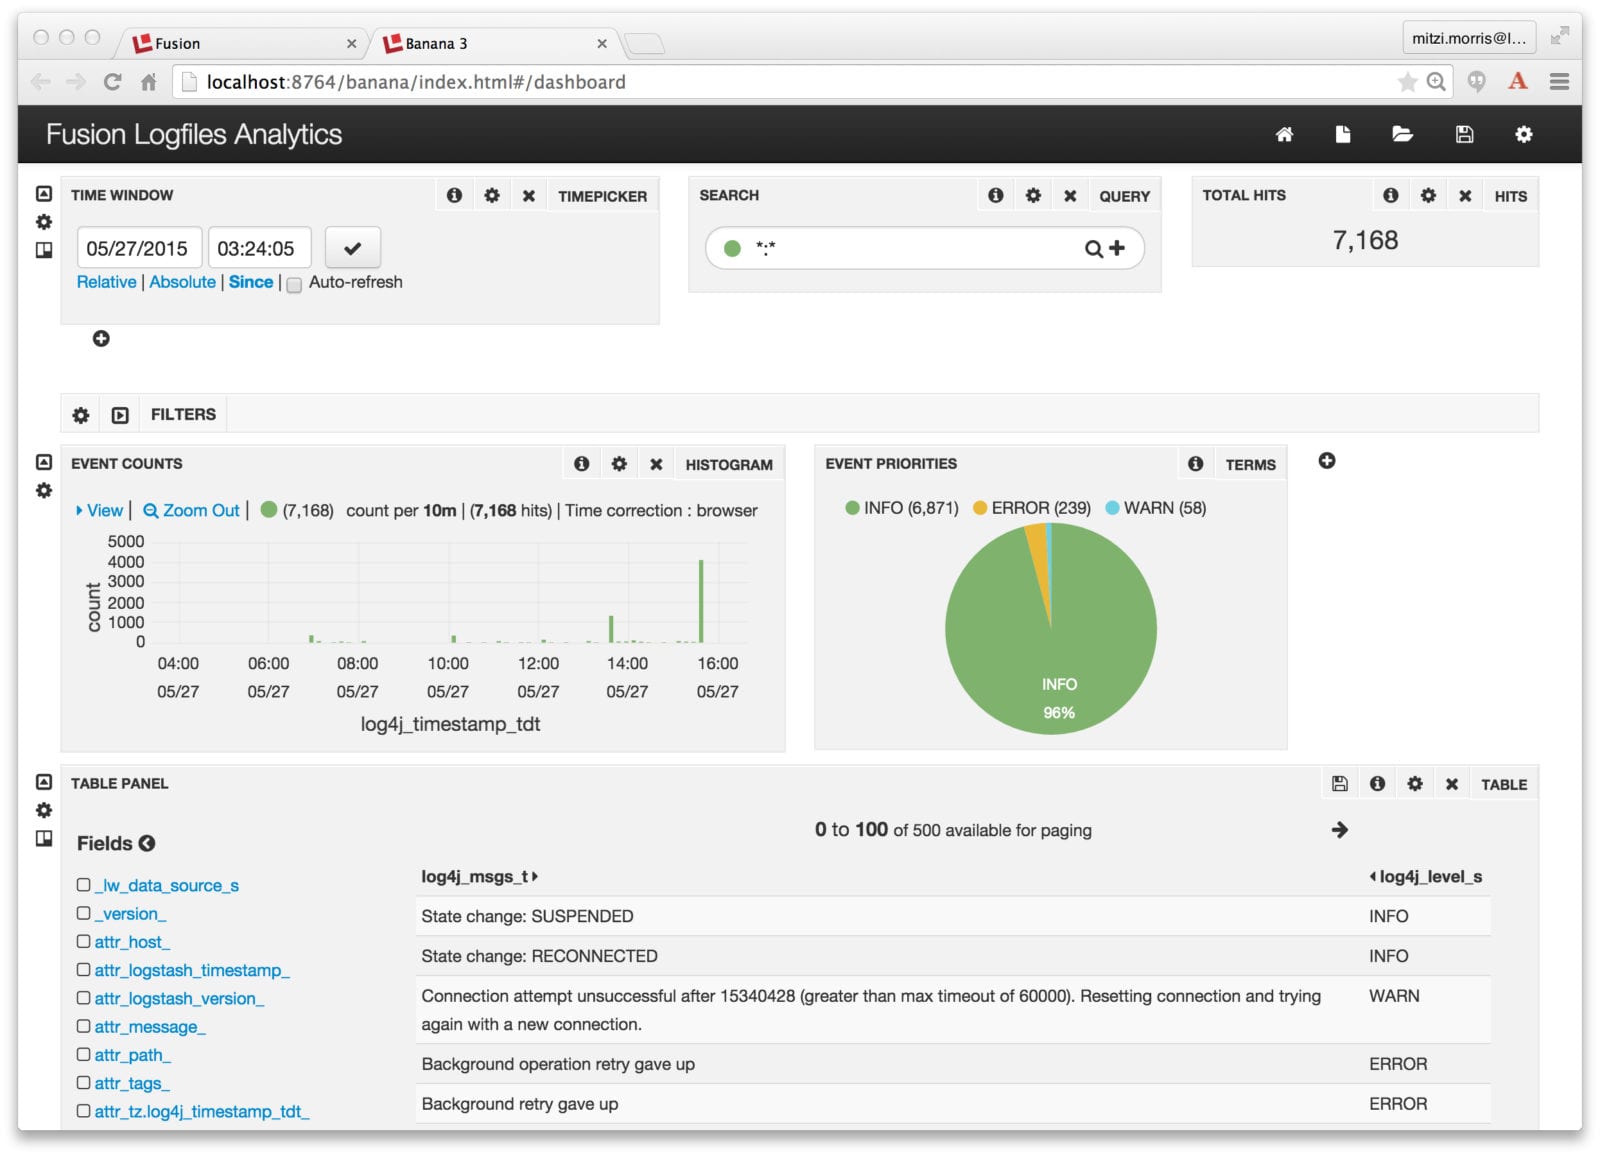
The Fusion Dashboards tool is the rightmost icon on the Fusion UI launchpad page. It can be accessed directly as: http://localhost:8764/banana/index.html#/dashboard. When opened from the Fusion launchpad, the Dashboards tool displays in a new tab labeled “Banana 3”. Time-series dashboards show trends over time by using the timestamp field to aggregate query results. To create a time-series dashboard over the collection “MyFusionLogfiles” I click on the new page icon in the upper right-hand corner of top menu, and choose to create a new time-series dashboard, specifying “MyFusionLogfiles” as the collection, and “log4j_timestamp_tdt” as the field. I modify the default time-series dashboard, again, by adding a pie chart that shows the breakdown of logging events by priority:

Et voilà! It all just works!
LEARN MORE
Contact us today to learn how Lucidworks can help your team create powerful search and discovery applications for your customers and employees.